. 2007 Oct 25:8:74.
doi: 10.1186/1471-2156-8-74.

Whole genome linkage disequilibrium maps in cattle

Affiliations

Whole genome linkage disequilibrium maps in cattle

Stephanie D McKay et al. BMC Genet. .

Abstract

Background: Bovine whole genome linkage disequilibrium maps were constructed for eight breeds of cattle. These data provide fundamental information concerning bovine genome organization which will allow the design of studies to associate genetic variation with economically important traits and also provides background information concerning the extent of long range linkage disequilibrium in cattle.

Results: Linkage disequilibrium was assessed using r2 among all pairs of syntenic markers within eight breeds of cattle from the Bos taurus and Bos indicus subspecies. Bos taurus breeds included Angus, Charolais, Dutch Black and White Dairy, Holstein, Japanese Black and Limousin while Bos indicus breeds included Brahman and Nelore. Approximately 2670 markers spanning the entire bovine autosomal genome were used to estimate pairwise r2 values. We found that the extent of linkage disequilibrium is no more than 0.5 Mb in these eight breeds of cattle.

Conclusion: Linkage disequilibrium in cattle has previously been reported to extend several tens of centimorgans. Our results, based on a much larger sample of marker loci and across eight breeds of cattle indicate that in cattle linkage disequilibrium persists over much more limited distances. Our findings suggest that 30,000-50,000 loci will be needed to conduct whole genome association studies in cattle.


Figures
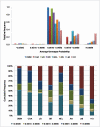
Figure 1
Figure 1
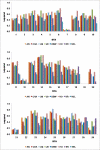
a and b. Summary of genotype (pGmx) and phase (oGmx) probabilities for each breed based on GENOPROB 2.0 results. Only genotyped progeny with at least one genotyped parent were used.
Figure 2
Figure 2
Minor allele frequencies (MAF) for all breeds.
Figure 3
Figure 3
Percentage of loci within each bin. Proportion of loci for each bin are shown based on inter-marker distances measured in Mb. The horizontal axis depicts the maximum inter-marker distance for each bin. Here, a majority of the markers fall within the 0.50 Mb bin, This bin includes all markers with an inter-marker distance greater than 0.10 Mb but less than or equal to 0.50 Mb.
Figure 4
Figure 4
Overall average r2 values. Average r2 values are shown for each breed. The maximum value for each bin is shown on the horizontal axis.
Figure 5
Figure 5
Estimates of D' and r2 for Holstein and Dutch Black and White Dairy cattle. Average LD is shown for each breed in each bin. The maximum inter-marker value for each bin is shown on the horizontal axis.
Figure 6
Figure 6
Average r2 values for inter-marker distances <1 kb for each breed and chromosome. Data are not presented for breed by chromosome combinations for which there were less than 5 informative locus pairs (BTA19).
Figure 7
Figure 7
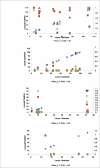
Distribution of SNPs along BTA6, 7, 12 and 21 respectively. Measures of LD, r2, are shown for Angus and Holstein. BTA6 was included for comparison purposes.

References

    1. Farnir F, Coppieters W, Arranz JJ, Berzi P, Cambisano N, Grisart B, Karim L, Marcq F, Moreau L, Mni M, Nezer C, Simon P, Vanmanshoven P, Wagenaar D, Georges M. Extensive genome-wide linkage disequilibrium in cattle. Genome Res. 2000;10:220–227. doi: 10.1101/gr.10.2.220. - DOI - PubMed
    1. Vallejo RL, Li YL, Rogers GW, Ashwell MS. Genetic diversity and background linkage disequilibrium in the North American Holstein cattle population. J Dairy Sci. 2003;86:4137–4147. - PubMed
    1. Tenesa A, Knott SA, Ward D, Smith D, Williams JL, Visscher PM. Estimation of linkage disequilibrium in a sample of the United Kingdom dairy cattle population using unphased genotypes. J Anim Sci. 2003;81:617–623. - PubMed
    1. Khatkar MS, Collins A, Cavanagh JA, Hawken RJ, Hobbs M, Zenger KR, Barris W, McClintock AE, Thomson PC, Nicholas FW, Raadsma HW. A first-generation metric linkage disequilibrium map of bovine chromosome 6. Genetics. 2006;174:79–85. doi: 10.1534/genetics.106.060418. - DOI - PMC - PubMed
    1. Varilo T, Paunio T, Parker A, Perola M, Meyer J, Terwilliger JD, Peltonen L. The interval of linkage disequilibrium (LD) detected with microsatellite and SNP markers in chromosomes of Finnish populations with different histories. Hum Mol Genet. 2003;12:51–59. doi: 10.1093/hmg/ddg005. - DOI - PubMed

Publication types

Substances

LinkOut - more resources