. 2007 Oct 26:8:390.
doi: 10.1186/1471-2164-8-390.

Large-scale analysis by SAGE reveals new mechanisms of v-erbA oncogene action

Affiliations

Large-scale analysis by SAGE reveals new mechanisms of v-erbA oncogene action

Corinne Bresson et al. BMC Genomics. .

Abstract

Background: The v-erbA oncogene, carried by the Avian Erythroblastosis Virus, derives from the c-erbAalpha proto-oncogene that encodes the nuclear receptor for triiodothyronine (T3R). v-ErbA transforms erythroid progenitors in vitro by blocking their differentiation, supposedly by interference with T3R and RAR (Retinoic Acid Receptor). However, v-ErbA target genes involved in its transforming activity still remain to be identified.

Results: By using Serial Analysis of Gene Expression (SAGE), we identified 110 genes deregulated by v-ErbA and potentially implicated in the transformation process. Bioinformatic analysis of promoter sequence and transcriptional assays point out a potential role of c-Myb in the v-ErbA effect. Furthermore, grouping of newly identified target genes by function revealed both expected (chromatin/transcription) and unexpected (protein metabolism) functions potentially deregulated by v-ErbA. We then focused our study on 15 of the new v-ErbA target genes and demonstrated by real time PCR that in majority their expression was activated neither by T3, nor RA, nor during differentiation. This was unexpected based upon the previously known role of v-ErbA.

Conclusion: This paper suggests the involvement of a wealth of new unanticipated mechanisms of v-ErbA action.


Figures

Figure 1
Figure 1
Comparative gene expression levels between VA and NTVA libraries. The occurrence number of each tag (normalized in tag per million) in VA (X axis) and NTVA (Y axis) libraries is represented on a logarithmic scale. Each point can represent one or more tags. Colour-coding is based on a statistical analysis (Z test [47]), adjusted for multiple testing according to the method proposed by Benjamini and Hochberg [48]. Black dots represent the 110 tags having an adjusted p-value < 0.1. These tags correspond to genes that are significantly differentially expressed between these 2 conditions. Among these genes, 44 are up-regulated (the corresponding points are located below the first bisecting line) and 66 are down-regulated (the corresponding points are located above the first bisecting line) in T2ECs expressing the transforming form of v-ErbA as compared to T2ECs expressing the non-transforming form of v-ErbA. The gray dots represent all the other tags.
Figure 2
Figure 2
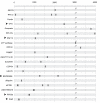
Position of the c-Myb binding motif in the promoter sequences of v-ErbA target genes. The position of the c-Myb binding motif (CAGTTA) is represented as grey boxes in the promoter regions of v-ErbA repressed genes containing at least one such motif (i.e. 64% of the v-ErbA repressed genes identified by SAGE). The 4 kb sequence flanking the transcription start site (TSS, shown at position 3000) are displayed. The following parameters were used for extracting this motif: minimal motif size: 5; maximum number of examples in the negative (v-ErbA activated) set: 5; minimum number of examples in the positive (v-ErbA repressed) set: 20. Arrowheads indicate the genes that have been validated as v-ErbA repressed genes by real time PCR.
Figure 3
Figure 3
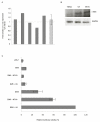
Expression level of c-Myb in T2ECs expressing v-ErbA or the S61G form of v-ErbA. 3A – Effect of v-ErbA on the expression level of the c-myb gene. Total RNA was extracted from T2ECs expressing either the oncogenic form or the non-transforming form of v-erbA. A reverse transcription and real-time PCR analysis were performed to quantify the expression level of c-myb gene. The fold variation is represented as VA/NTVA ratio and corresponds to a decrease or an increase of the c-myb mRNA in T2ECs expressing the transforming form of v-ErbA (VA) in comparison with T2ECs expressing the non-transforming form of v-ErbA (NTVA). The grey bars represent a mean of ratio calculated using the three reference genes T-Complex 1, hnRNP and ATP synthase subunit B1. The hatched bar is the mean of mRNA accumulation in the five independent experiments. 3B – Effect of v-ErbA on the expression level of the c-Myb protein. T2ECs were either left non-infected (T2ECs), infected by a retrovirus carrying the wild type v-ErbA (VA) or carrying the point-mutated form of v-ErbA, S61G (NTVA). Protein extracts (30 μg) were analyzed and two separate western blots were probed with an anti-c-Myb or anti-GAPDH antibody. 3C – Different effects of v-ErbA and S61G on c-Myb responsive transcription. T2ECs were transfected with reporter plasmids containing either five wild-type (EW5) or mutant (EM5) Myb-binding sites upstream of a simple TATA box. Each reporter was tested with a vector expressing or not the transforming form of v-ErbA (VA) or a vector expressing the S61G mutant for v-ErbA (NTVA) and the β-Galactosidase expressing plasmid. Twenty-four hours after transfection, the cells were analyzed for luciferase activity, which reflects the ability of the c-Myb protein to regulate the gene expression. Luciferase activities were normalized by using β-Gal expression as an internal control. Luciferase activity in the presence of EW5 and the transforming form of v-ErbA was assigned to a value of 100%. The pGL2 plasmid transfected in normal T2ECs represents the negative control (vector which does not contain any binding sites upstream the luciferase coding region). Data are average of two (EM5 and pGL2) to three experiments (EW5) and error bars indicate maximum and minimum values of different sets of data points.
Figure 4
Figure 4
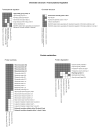
Cellular functions of genes repressed by the transforming form of v-ErbA. This figure shows the two main cellular functions of genes repressed by the transforming form of v-ErbA. For each function, the annotations of all genes harbouring this function is represented (only the more precise term in the Gene Ontology and only the annotations concerning more than one half of genes are represented. GO MF: Gene Ontology molecular function, GO BP: Gene Ontology biological process, SP KW: Swissprot keyword, KEGG PW: KEGG pathway). A black square in the intersection of one line (one gene) and one column (one annotation) imply that the corresponding gene has the corresponding annotation. The gene names written in bold correspond to genes for which the differential expression has been confirmed by real-time PCR.
Figure 5
Figure 5
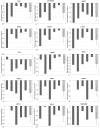
Real time PCR validation on multiple experiments. The results of the real-time PCR quantification of genes repressed by the transforming form of v-ErbA and identified by SAGE are presented. Total RNA was extracted from the T2ECs expressing either the oncogenic form or the non-transforming form of v-erbA. A reverse transcription and real-time PCR analysis were performed to quantify the expression level of different genes. The fold repression is represented, corresponding to a decrease of mRNA accumulation in T2ECs expressing the transforming form of v-ErbA (VA) in comparison with T2ECs expressing the non-transforming form of v-ErbA (NTVA). The grey bars represent a mean of ratio calculated using three reference genes T-Complex 1, hnRNP and ATP synthase subunit B1. The hatched bar is the mean of mRNA accumulation in the five independent experiments.
Figure 6
Figure 6
Assessment of the v-ErbA target gene expression in response to different factors. 6A – Comparison between the v-ErbA and the differentiation target genes. The Venn Diagrams represent a comparison between the list of v-ErbA repressed target genes (this study) and the genes upregulated during T2ECs differentiation [34] (Left part of the figure) or the list of v-ErbA activated target genes and the genes repressed during T2ECs differentiation (Right part of the figure). 6B – Comparison of v-ErbA, differentiation, T3 and RA target genes. The Venn diagram summarizes the overlap in the sets of genes that were activated or repressed in response to v-ErbA or/and T3 or/and RA or/and during the differentiation process in T2ECs.
Figure 7
Figure 7
Expression of the v-ErbA target genes identified in T2ECs, in CEFs expressing v-ErbA or the S61G form of v-ErbA. Total RNA was extracted from CEFs expressing either the oncogenic form or the non-transforming form of v-erbA. A reverse transcription and real-time PCR analysis were performed to quantify the expression level of genes, which are repressed by v-ErbA in T2ECs. The fold variation is represented as VA/NTVA ratio and corresponds to a decrease or an increase of the different mRNA in CEFs expressing the transforming form of v-ErbA (VA) in comparison with CEFs expressing the non-transforming form of v-ErbA (NTVA). The results were normalized using four reference genes T-Complex 1, hnRNP, ATP synthase subunit B1 and GAPDH, and correspond to the mean with standard deviation of four to five independent experiments. This figure presents the results of the expression level quantification of most v-ErbA target genes, except for MGC83969 gene that could not be amplified.

Similar articles

Cited by

References

    1. Graf T, Beug H. Avian leukemia viruses: interaction with their target cells in vivo and in vitro. Biochim Biophys Acta. 1978;516:269–299. - PubMed
    1. Casini T, Graf T. Bicistronic retroviral vector reveals capacity of v-erbA to induce erythroleukemia and to co-operate with v-myb. Oncogene. 1995;11:1019–1026. - PubMed
    1. Gandrillon O, Jurdic P, Pain B, Desbois C, Madjar JJ, Moscovici MG, Moscovici C, Samarut J. Expression of the v-erbA product, an altered nuclear hormone receptor, is sufficient to transform erythrocytic cells in vitro. Cell. 1989;58:115–121. doi: 10.1016/0092-8674(89)90408-X. - DOI - PubMed
    1. Sap J, Munoz A, Damm K, Goldberg Y, Ghysdael J, Leutz A, Beug H, Vennstrom B. The c-erb-A protein is a high-affinity receptor for thyroid hormone. Nature. 1986;324:635–640. doi: 10.1038/324635a0. - DOI - PubMed
    1. Damm K, Thompson CC, Evans RM. Protein encoded by v-erbA functions as a thyroid-hormone receptor antagonist. Nature. 1989;339:593–597. doi: 10.1038/339593a0. - DOI - PubMed

Publication types

Substances

LinkOut - more resources