

Clinical Trial
doi: 10.1016/j.visres.2007.09.006.
Epub 2007 Oct 24.
Contrast discrimination: second responses reveal the relationship between the mean and variance of visual signals
Affiliations
- PMID: 17961625
- PMCID: PMC2386851
- DOI: 10.1016/j.visres.2007.09.006
Item in Clipboard
Clinical Trial
Contrast discrimination: second responses reveal the relationship between the mean and variance of visual signals
Vision Res.
2007 Dec.
Abstract
To explain the relationship between first- and second-response accuracies in a detection experiment, Swets, Tanner, and Birdsall [Swets, J., Tanner, W. P., Jr., & Birdsall, T. G. (1961). Decision processes in perception. Psychological Review, 68, 301-340] proposed that the variance of visual signals increased with their means. However, both a low threshold and intrinsic uncertainty produce similar relationships. I measured the relationship between first- and second-response accuracies for suprathreshold contrast discrimination, which is thought to be unaffected by sensory thresholds and intrinsic uncertainty. The results are consistent with a slowly increasing variance.
Figures
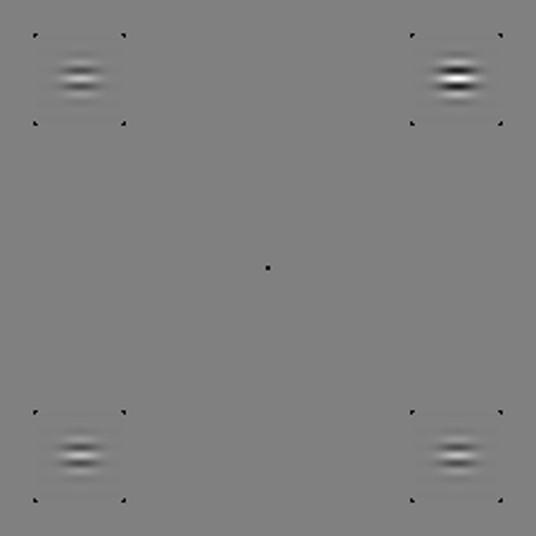
Example stimulus. One Gabor has more contrast than the others. When
those others have sufficient “pedestal” contrast for essentially
perfect detection, neither intrinsic uncertainty nor a sensory threshold can
contaminate an observer’s decision as to which of the four is most
intense. For JAS and MJM, all of the black spots disappeared during each 0.18-s
stimulus exposure. For the other observers, only the central fixation spot
disappeared.
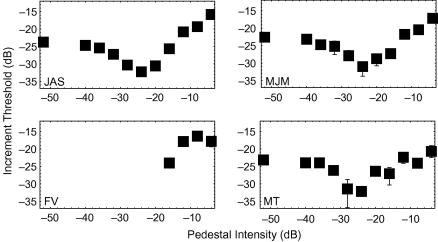
Threshold-vs.-contrast functions for first responses in four
observers. Error bars contain 95% confidence intervals.
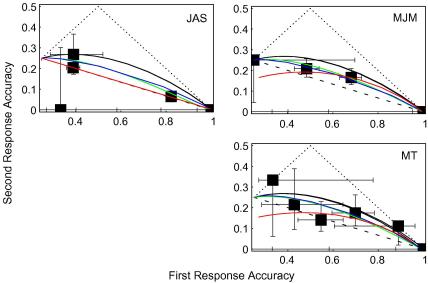
Two-response, four-alternative-forced-choice (2R4AFC), detection
results for three observers. Each box represents a unique intensity. Error bars
contain 95% confidence intervals. The solid black curves show simple
signal-detection theory (SDT). Dashed lines show high-threshold theory. Dotted
lines are mathematical and theoretical upper bounds for second-response
accuracies. The green, blue and red curves show, respectively, the
maximum-likelihood fits of SDT modified with increasing noise, intrinsic
uncertainty and a low threshold.
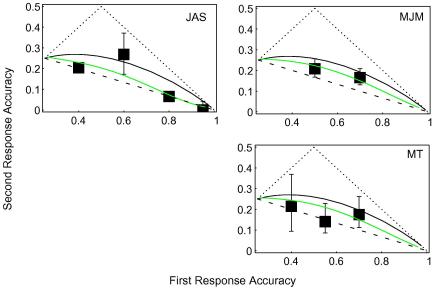
Cleaned-up 2R4AFC detection results (see text). Green curves show
the best fit of SDT with increasing variance. (For interpretation of the
references to colour in this figure legend, the reader is referred to the web
version of this article.)
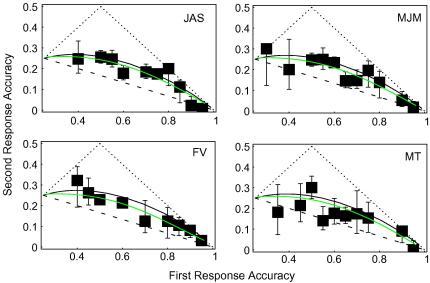
2R4AFC contrast-discrimination results. Green curves show the best
fit of SDT with increasing variance. (For interpretation of the references to
colour in this figure legend, the reader is referred to the web version of this
article.)
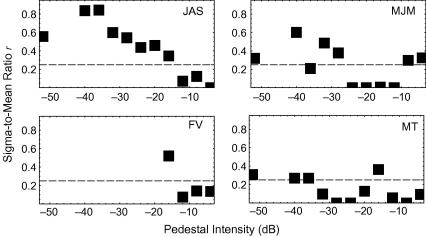
How the sigma-to-mean ratio varies with signal intensity. Dashed
lines indicate Swets et al.’s
(1961) estimate, based on detection data.
References
-
- Blackwell H.R. Neural theories of simple visual discriminations. Journal of the Optical Society of America. 1963;53:129–160. - PubMed
-
- Blackwell K.T. The effect of white and filtered noise on contrast detection thresholds. Vision Research. 1998;38:267–280. - PubMed
-
- Foley J.M. Human luminance pattern mechanisms: Masking experiments require a new model. Journal of the Optical Society of America A. 1994;1:1710–1719. - PubMed
-
- Foley, J. M., & Boynton, G. M. (1994). A new model of human luminance pattern vision mechanisms: Analysis of the effects of pattern orientation, spatial phase and temporal frequency. In: T. B. Lawton (Ed.), Computational vision based on neurobiology, SPIE Proceedings (Vol. 2054, pp. 32–42).
Publication types
MeSH terms
Grants and funding
LinkOut - more resources
Full Text Sources
