

Quantification of nicotinic acetylcholine receptors in the human brain with PET: bolus plus infusion administration of 2-[18F]F-A85380
- PMID: 17962044
- PMCID: PMC2386978
- DOI: 10.1016/j.neuroimage.2007.09.015
Quantification of nicotinic acetylcholine receptors in the human brain with PET: bolus plus infusion administration of 2-[18F]F-A85380
Abstract
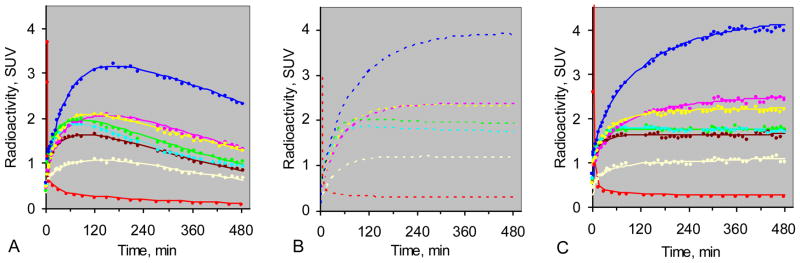
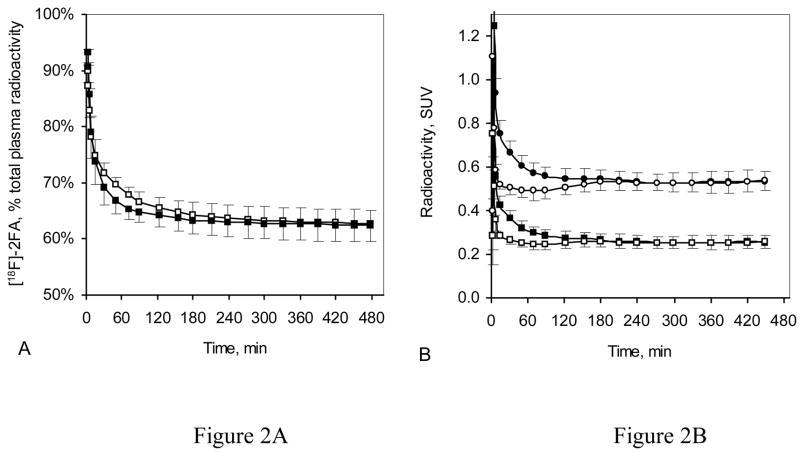
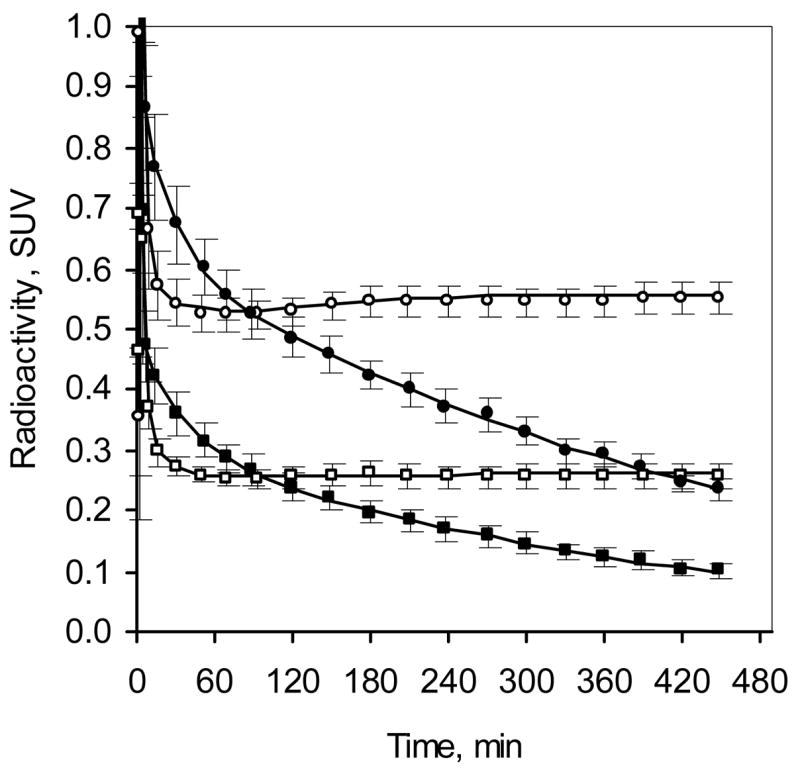
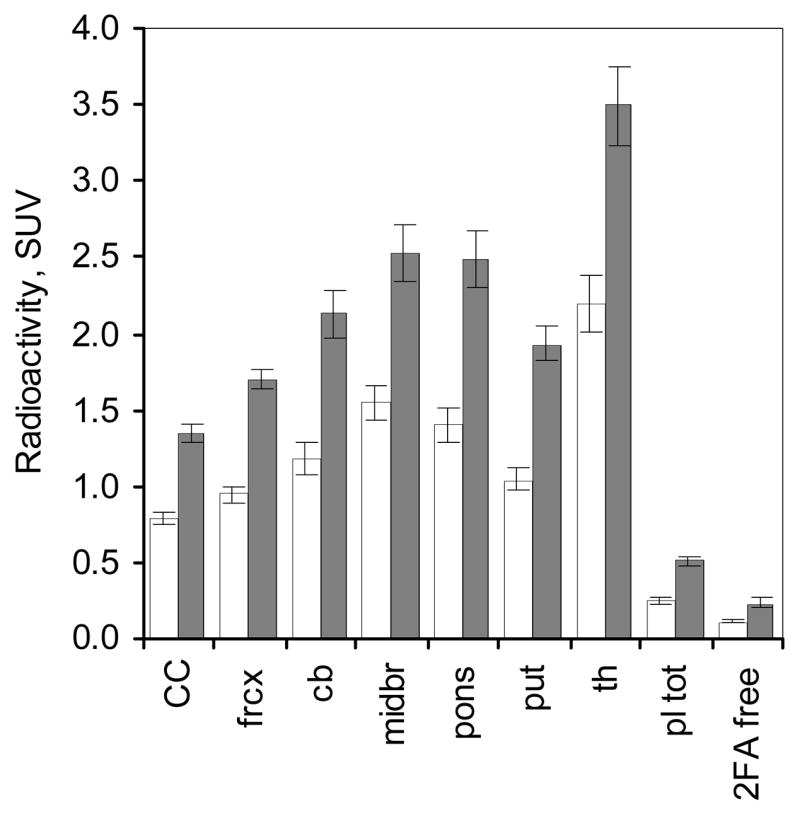
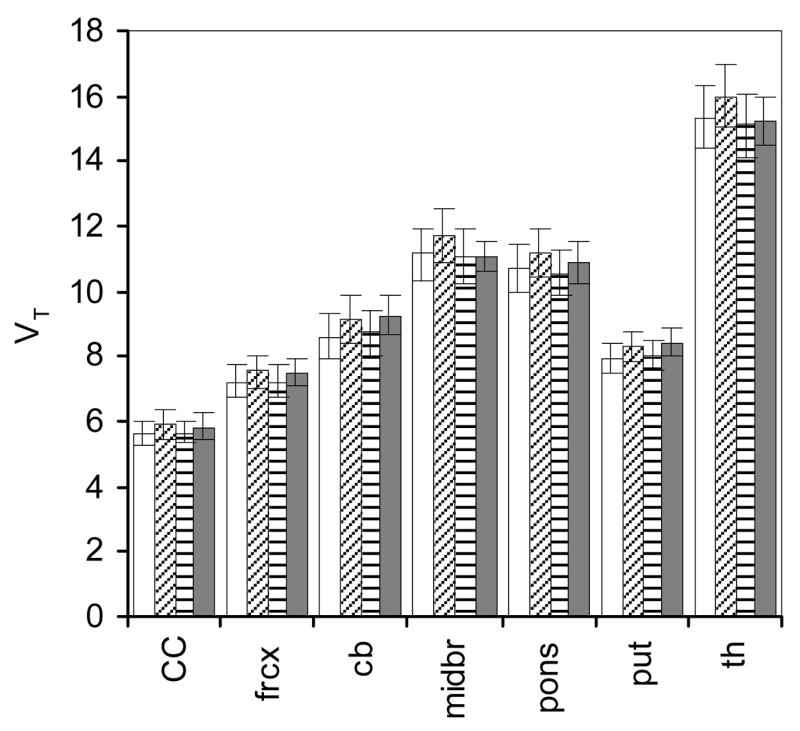
Quantitative analysis of most positron emission tomography (PET) data requires arterial blood sampling and dynamic scanning when the radioligand is administered as a bolus injection. Less invasive studies can be accomplished if the radioligand is administered as a bolus plus constant infusion (B/I). The purpose of the current study was to evaluate a B/I paradigm for quantifying high affinity nicotinic acetylcholine receptors (nAChRs) with PET and 2-[(18)F]F-A85380 (2FA). Seven volunteers underwent a study in which 2FA was administered as a bolus injection and another study in which the 2FA was administered by B/I (Kbolus=500 min). We evaluated the feasibility of using scans of a 2 h duration starting 6 h after the start of the 2FA administration and data from venous blood. Radioactivity in the brain and in arterial and venous plasma reached steady state by 6 h. Volumes of distribution (V(T)) calculated from the ratio of radioactivity in the brain areas of interest to the radioactivity corresponding to unbound, unmetabolized 2FA in venous plasma at steady state in the B/I studies were very similar to those calculated from time activity curves of unbound, unmetabolized 2FA in arterial plasma and regional brain radioactivity from 8-h dynamic scans after bolus administration of 2FA. The results of repeated PET studies with 2FA showed a high reproducibility of V(T) measurements. We conclude that B/I methodology will be useful for clinical and research studies of brain nAChRs.
Figures


Similar articles
-
Greater nicotinic acetylcholine receptor density in smokers than in nonsmokers: a PET study with 2-18F-FA-85380.J Nucl Med. 2008 Oct;49(10):1628-35. doi: 10.2967/jnumed.108.050716. Epub 2008 Sep 15. J Nucl Med. 2008. PMID: 18794265 Free PMC article.
-
Imaging of cerebral α4β2* nicotinic acetylcholine receptors with (-)-[(18)F]Flubatine PET: Implementation of bolus plus constant infusion and sensitivity to acetylcholine in human brain.Neuroimage. 2016 Nov 1;141:71-80. doi: 10.1016/j.neuroimage.2016.07.026. Epub 2016 Jul 15. Neuroimage. 2016. PMID: 27426839 Free PMC article.
-
123I-5-IA-85380 SPECT measurement of nicotinic acetylcholine receptors in human brain by the constant infusion paradigm: feasibility and reproducibility.J Nucl Med. 2005 Sep;46(9):1466-72. J Nucl Med. 2005. PMID: 16157529 Clinical Trial.
-
Central in vivo nicotinic acetylcholine receptor imaging agents for positron emission tomography (PET) and single photon emission computed tomography (SPECT).Biol Pharm Bull. 2009 Mar;32(3):337-40. doi: 10.1248/bpb.32.337. Biol Pharm Bull. 2009. PMID: 19252274 Review.
-
Recent PET radioligands with optimal brain kinetics for imaging nicotinic acetylcholine receptors.J Labelled Comp Radiopharm. 2013 Mar-Apr;56(3-4):159-66. doi: 10.1002/jlcr.3020. J Labelled Comp Radiopharm. 2013. PMID: 24285321 Review.
Cited by
-
[18 F]Nifene test-retest reproducibility in first-in-human imaging of α4β2* nicotinic acetylcholine receptors.Synapse. 2017 Aug;71(8):10.1002/syn.21981. doi: 10.1002/syn.21981. Epub 2017 Apr 26. Synapse. 2017. PMID: 28420041 Free PMC article.
-
Brain nicotinic acetylcholine receptor occupancy: effect of smoking a denicotinized cigarette.Int J Neuropsychopharmacol. 2009 Apr;12(3):305-16. doi: 10.1017/S146114570800922X. Epub 2008 Aug 18. Int J Neuropsychopharmacol. 2009. PMID: 18706128 Free PMC article. Clinical Trial.
-
Greater nicotinic acetylcholine receptor density in smokers than in nonsmokers: a PET study with 2-18F-FA-85380.J Nucl Med. 2008 Oct;49(10):1628-35. doi: 10.2967/jnumed.108.050716. Epub 2008 Sep 15. J Nucl Med. 2008. PMID: 18794265 Free PMC article.
-
Basal forebrain cholinergic signalling: development, connectivity and roles in cognition.Nat Rev Neurosci. 2023 Apr;24(4):233-251. doi: 10.1038/s41583-023-00677-x. Epub 2023 Feb 23. Nat Rev Neurosci. 2023. PMID: 36823458 Free PMC article. Review.
-
Imaging of cerebral α4β2* nicotinic acetylcholine receptors with (-)-[(18)F]Flubatine PET: Implementation of bolus plus constant infusion and sensitivity to acetylcholine in human brain.Neuroimage. 2016 Nov 1;141:71-80. doi: 10.1016/j.neuroimage.2016.07.026. Epub 2016 Jul 15. Neuroimage. 2016. PMID: 27426839 Free PMC article.
References
-
- Abi-Dargham A, Laruelle M, Seibyl J, Rattner Z, Baldwin RM, Zoghbi SS, Zea-Ponce Y, Bremner JD, Hyde TM, Charney DS. SPECT measurement of benzodiazepine receptors in human brain with iodine-123-iomazenil: kinetic and equilibrium paradigms. J Nucl Med. 1994;35:228–238. - PubMed
-
- Benwell ME, Balfour DJ, Anderson JM. Evidence that tobacco smoking increases the density of (−)-[3H]nicotine binding sites in human brain. J Neurochem. 1988;50:1243–1247. - PubMed
-
- Bergström M, Grahnén A, Långström B. Positron emission tomography microdosing: a new concept with application in tracer and early clinical drug development. Eur J Clin Pharmacol. 2003;59:357–366. - PubMed
-
- Breese CR, Marks MJ, Logel J, Adams CE, Sullivan B, Collins AC, Leonard S. Effect of smoking history on [3H]nicotine binding in human postmortem brain. J Pharmacol Exp Ther. 1997;282:7–13. - PubMed
Publication types
MeSH terms
Substances
Grants and funding
LinkOut - more resources
Full Text Sources
