

Differential modulation of short-term synaptic dynamics by long-term potentiation at mouse hippocampal mossy fibre synapses
- PMID: 17962326
- PMCID: PMC2375525
- DOI: 10.1113/jphysiol.2007.143925
Differential modulation of short-term synaptic dynamics by long-term potentiation at mouse hippocampal mossy fibre synapses
Abstract
Synapses continuously experience short- and long-lasting activity-dependent changes in synaptic strength. Long-term plasticity refers to persistent alterations in synaptic efficacy, whereas short-term plasticity (STP) reflects the instantaneous and reversible modulation of synaptic strength in response to varying presynaptic stimuli. The hippocampal mossy fibre synapse onto CA3 pyramidal cells is known to exhibit both a presynaptic, NMDA receptor-independent form of long-term potentiation (LTP) and a pronounced form of STP. A detailed description of their exact interdependence is, however, lacking. Here, using electrophysiological and computational techniques, we have developed a descriptive model of transmission dynamics to quantify plasticity at the mossy fibre synapse. STP at this synapse is best described by two facilitatory processes acting on time-scales of a few hundred milliseconds and about 10 s. We find that these distinct types of facilitation are differentially influenced by LTP such that the impact of the fast process is weakened as compared to that of the slow process. This attenuation is reflected by a selective decrease of not only the amplitude but also the time constant of the fast facilitation. We henceforth argue that LTP, involving a modulation of parameters determining both amplitude and time course of STP, serves as a mechanism to adapt the mossy fibre synapse to its temporal input.
Figures
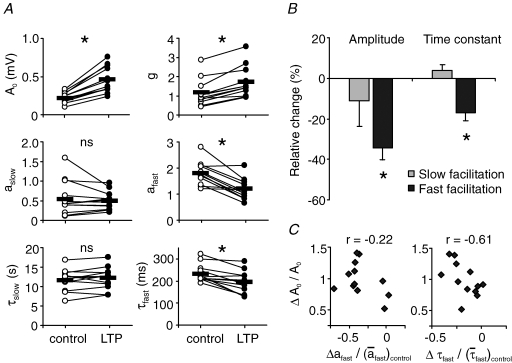
 , were calculated as Δa = aLTP − acontrol and
  . C, the decrease of the fast time constant τfast after LTP is significantly correlated to the relative change in A0, while the amplitude of the fast process afast is not.
Similar articles
-
Differential mechanisms of transmission at three types of mossy fiber synapse.J Neurosci. 2000 Nov 15;20(22):8279-89. doi: 10.1523/JNEUROSCI.20-22-08279.2000. J Neurosci. 2000. PMID: 11069934 Free PMC article.
-
Photolysis of postsynaptic caged Ca2+ can potentiate and depress mossy fiber synaptic responses in rat hippocampal CA3 pyramidal neurons.J Neurophysiol. 2004 Apr;91(4):1596-607. doi: 10.1152/jn.01073.2003. Epub 2003 Nov 26. J Neurophysiol. 2004. PMID: 14645386 Free PMC article.
-
Long-term synaptic changes induced by intracellular tetanization of CA3 pyramidal neurons in hippocampal slices from juvenile rats.Neuroscience. 1999;93(2):469-77. doi: 10.1016/s0306-4522(99)00167-0. Neuroscience. 1999. PMID: 10465429
-
Synaptic plasticity at hippocampal mossy fibre synapses.Nat Rev Neurosci. 2005 Nov;6(11):863-76. doi: 10.1038/nrn1786. Nat Rev Neurosci. 2005. PMID: 16261180 Review.
-
Kainate receptors and the induction of mossy fibre long-term potentiation.Philos Trans R Soc Lond B Biol Sci. 2003 Apr 29;358(1432):657-66. doi: 10.1098/rstb.2002.1216. Philos Trans R Soc Lond B Biol Sci. 2003. PMID: 12740111 Free PMC article. Review.
Cited by
-
Synaptopodin Regulates Denervation-Induced Plasticity at Hippocampal Mossy Fiber Synapses.Cells. 2024 Jan 6;13(2):114. doi: 10.3390/cells13020114. Cells. 2024. PMID: 38247806 Free PMC article.
-
Natural spike trains trigger short- and long-lasting dynamics at hippocampal mossy fiber synapses in rodents.PLoS One. 2010 Apr 1;5(4):e9961. doi: 10.1371/journal.pone.0009961. PLoS One. 2010. PMID: 20376354 Free PMC article.
-
Altered axonal targeting and short-term plasticity in the hippocampus of Disc1 mutant mice.Proc Natl Acad Sci U S A. 2011 Dec 6;108(49):E1349-58. doi: 10.1073/pnas.1114113108. Epub 2011 Nov 2. Proc Natl Acad Sci U S A. 2011. PMID: 22049344 Free PMC article.
-
Isolating the kinetics of facilitation in the mossy fibre pathway.J Physiol. 2008 Jun 1;586(11):2671-2. doi: 10.1113/jphysiol.2008.154070. Epub 2008 Apr 17. J Physiol. 2008. PMID: 18420700 Free PMC article. No abstract available.
-
Dentate gyrus granule cell firing patterns can induce mossy fiber long-term potentiation in vitro.Hippocampus. 2011 Nov;21(11):1157-68. doi: 10.1002/hipo.20815. Epub 2010 Jun 1. Hippocampus. 2011. PMID: 20635414 Free PMC article.
References
-
- Abbott LF, Varela JA, Sen K, Nelson SB. Synaptic depression and cortical gain control. Science. 1997;275:220–224. - PubMed
-
- Bear MF, Malenka RC. Synaptic plasticity: LTP and LTD. Curr Opin Neurobiol. 1994;4:389–399. - PubMed
-
- Bliss TV, Collingridge GL. A synaptic model of memory: long-term potentiation in the hippocampus. Nature. 1993;361:31–39. - PubMed
-
- Buzsaki G, Czeh G. Physiological function of granule cells: a hypothesis. Epilepsy Res Suppl. 1992;7:281–290. - PubMed
Publication types
MeSH terms
Substances
LinkOut - more resources
Full Text Sources
Miscellaneous