. 2008 Jan 1;586(1):227-45.
doi: 10.1113/jphysiol.2007.143172. Epub 2007 Oct 25.

Modulation of glycine potency in rat recombinant NMDA receptors containing chimeric NR2A/2D subunits expressed in Xenopus laevis oocytes

Affiliations

Modulation of glycine potency in rat recombinant NMDA receptors containing chimeric NR2A/2D subunits expressed in Xenopus laevis oocytes

Philip E Chen et al. J Physiol. .

Abstract

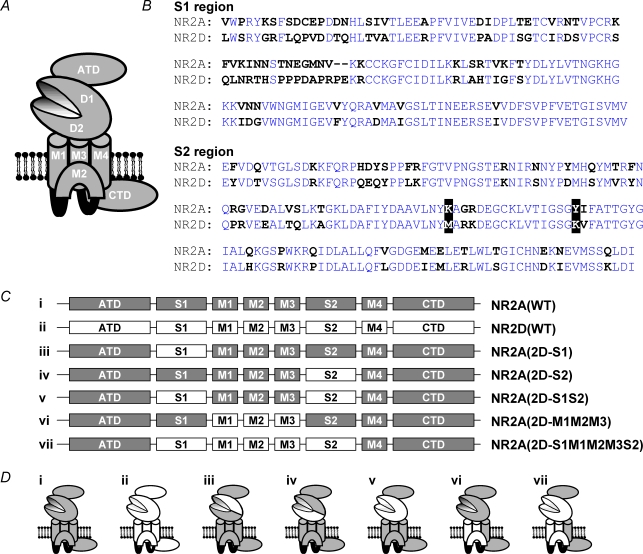
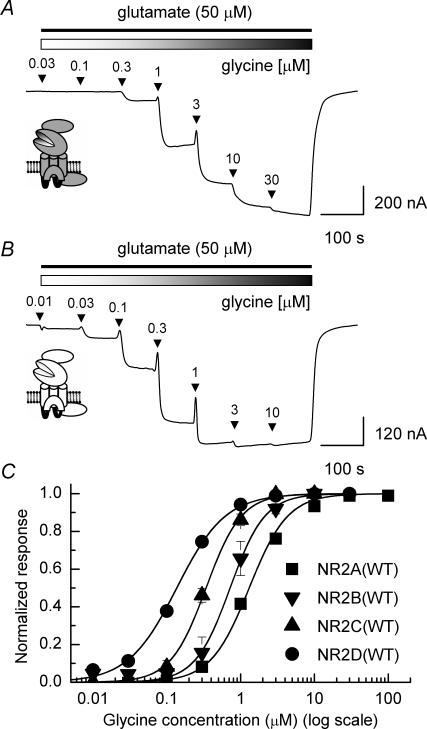
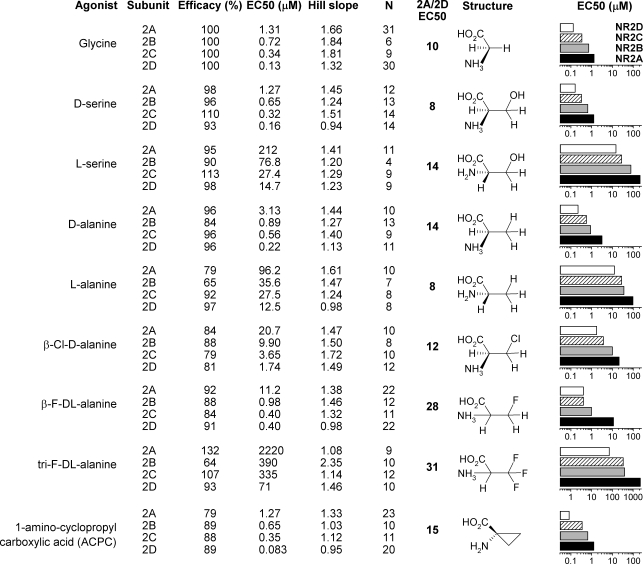
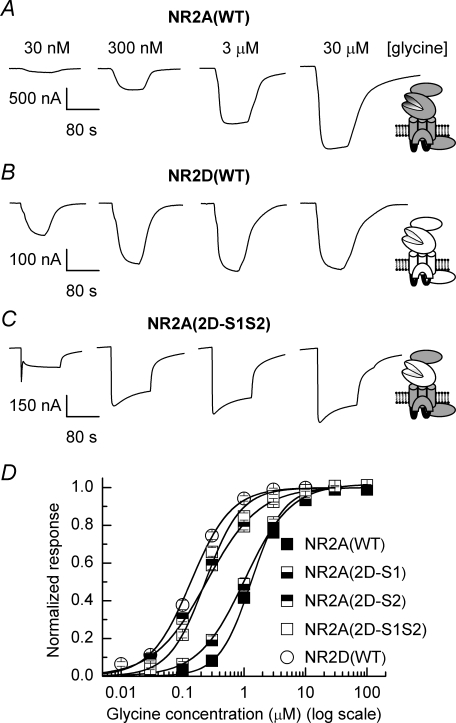
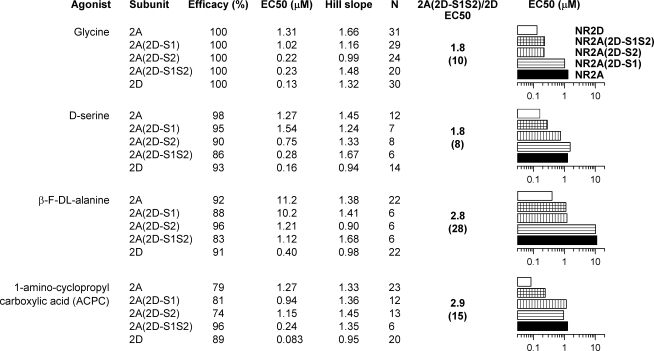
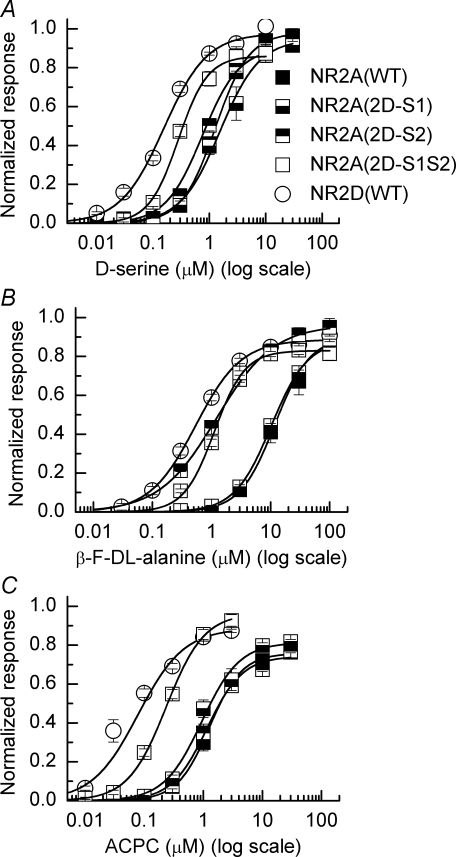
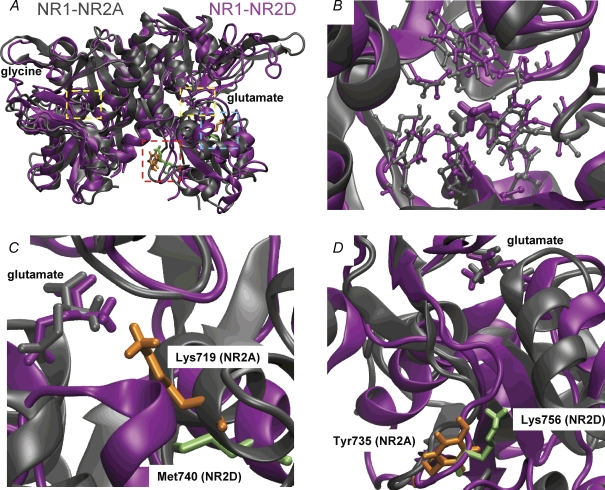
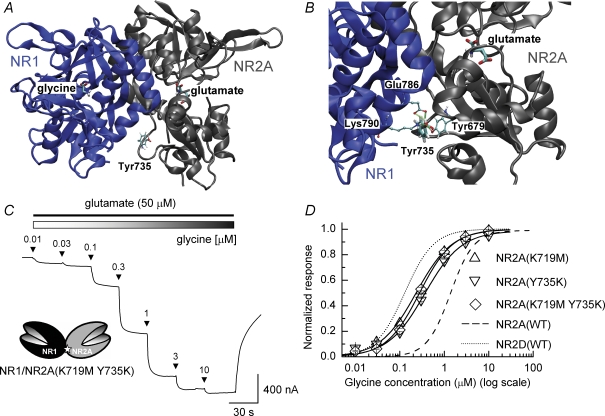
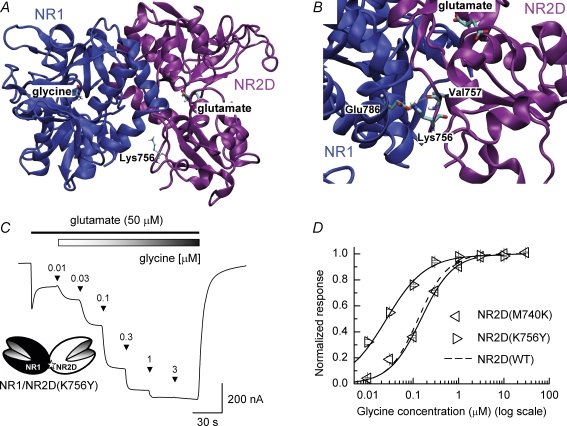
Heteromeric NMDARs are composed of coagonist glycine-binding NR1 subunits and glutamate-binding NR2 subunits. The majority of functional NMDARs in the mammalian central nervous system (CNS) contain two NR1 subunits and two NR2 subunits of which there are four types (A-D). We show that the potency of a variety of endogenous and synthetic glycine-site coagonists varies between recombinant NMDARs such that the highest potency is seen at NR2D-containing and the lowest at NR2A-containing NMDARs. This heterogeneity is specified by the particular NR2 subunit within the NMDAR complex since the glycine-binding NR1 subunit is common to all NMDARs investigated. To identify the molecular determinants responsible for this heterogeneity, we generated chimeric NR2A/2D subunits where we exchanged the S1 and S2 regions that form the ligand-binding domains and coexpressed these with NR1 subunits in Xenopus laevis oocytes. Glycine concentration-response curves for NMDARs containing NR2A subunits including the NR2D S1 region gave mean glycine EC(50) values similar to NR2A(WT)-containing NMDARs. However, receptors containing NR2A subunits including the NR2D S2 region or both NR2D S1 and S2 regions gave glycine potencies similar to those seen in NR2D(WT)-containing NMDARs. In particular, two residues in the S2 region of the NR2A subunit (Lys719 and Tyr735) when mutated to the corresponding residues found in the NR2D subunit influence glycine potency. We conclude that the variation in glycine potency is caused by interactions between the NR1 and NR2 ligand-binding domains that occur following agonist binding and which may be involved in the initial conformation changes that determine channel gating.


Figures

Figure 1
Figure 1. Outline structure of an NMDAR subunit, sequences of the S1 and S2 regions in NR2A and NR2D NMDAR subunits and pictorial representation of the various chimeras investigated
A, cartoon sketch of an ionotropic glutamate receptor subunit showing the proposed membrane topology of three membrane spanning domains (M1, M3 and M4) and a re-entrant loop (M2) and the location of the amino terminal domain (ATD) and carboxy terminal domain (CTD). The ligand binding domains (denoted D1 and D2) are formed by the S1 and S2 regions of the protein which come together to form a hinged clamshell-like structure. B, amino acid sequence of the S1 and S2 regions of NR2A and NR2D NMDAR subunits. The S1 region contains amino acids that contribute mainly, but not exclusively, to Domain1 of the ligand-binding site, while those in S2 contribute mainly, but not exclusively, to Domain2 of the ligand-binding site. Amino acids which are different in NR2A and NR2D NMDAR subunits are highlighted in bold. C, linear representation of wild-type NR2A and NR2D NMDAR subunits. The main structural-forming domains are shown in grey for NR2A and white for NR2D NMDAR subunits. The various chimeric subunits that have been investigated in this study are shown together with the source of each of the domains in the chimeric subunits and the nomenclature used to describe them. D, cartoon representation of the constructs (i–vii, shown in C) illustrating how the various functional domains from the NR2D subunit are incorporated into the five chimeric subunits investigated in this study.
Figure 2
Figure 2. Example TEVC current traces showing responses evoked by increasing concentrations of glycine for NR1/NR2A and NR1/NR2D NMDARs
A, example TEVC current recording obtained from an oocyte expressing NR1/NR2A(WT) NMDARs. In the presence of glutamate (50 μm), increasing concentrations of glycine (30 nm to 30 μm) were applied cumulatively. B, as A but recorded from an oocyte expressing NR1/NR2D(WT) NMDARs and with the range of glycine concentrations applied being 10 nm to 10 μm. Note the increased glycine potency at NR2D-containing compared to NR2A-containing NMDARs. C, mean glycine concentration–response curves for each of the four NMDAR subtypes. The rank order of glycine potency (highest potency, lowest EC50) is NR2D > NR2C > NR2B > NR2A with the mean EC50 values and Hill slopes for each of the NMDAR combinations given in Fig. 3.
Figure 3
Figure 3. Summary of the potencies and ‘relative efficacies’ of ligands acting at the NR1 coagonist binding site for each of the four heterodimeric NMDARs
Mean EC50 and Hill slope values obtained from fitting concentration–response relationships for a series of NR1 agonists. Efficacy denotes the maximal current response to the test agonist relative to the maximal response to glycine. The ratio of the EC50 at NR1/NR2A compared to NR1/NR2D NMDARs is given to indicate the agonist selectivity between these two NMDAR subtypes. The structures of the various agonists are also illustrated together with the subunit dependence of the EC50 for each agonist. Notice that for each agonist studied, greatest potency is seen at NR2D-containing NMDARs and the least at NR2A-containing NMDARs.
Figure 4
Figure 4. Glycine concentration–response data for wild-type and chimeric NMDARs
A, representative TEVC current recordings obtained from an oocyte expressing NR1/NR2A(WT) NMDARs, elicited by increasing concentrations of glycine (30 nm to 30 μm; in the presence of glutamate (50 μm)). B, representative TEVC current recordings obtained from an oocyte expressing NR1/NR2D(WT) NMDARs, elicited by the same concentrations of glycine (and glutamate) as illustrated in A. Notice that in contrast to the recordings shown in A, responses to 3 μm and 30 μm glycine evoke similarly sized currents indicating that the potency of glycine is greater at NR2D-containing NMDARs. C, representative TEVC current recordings obtained from an oocyte expressing NR1/NR2A(2D-S1S2) NMDARs, elicited by the same agonist concentrations as shown in A and B. D, mean concentration–response curves for glycine acting at NR1/NR2A(WT) and NR1/NR2D(WT) NMDARs as well as each of the three ‘binding’ domain chimeric NMDARs. Mean EC50 values and Hill slopes for each of the NMDAR combinations are given in Fig. 6. The mean Hill slopes and mean maximal currents recorded were for NR2A(WT): 1.66 ± 0.08, 1.7 ± 0.4 μA; NR2D(WT): 1.32 ± 0.07, 0.4 ± 0.06 μA; NR2A(2D-S1): 1.16 ± 0.04, 1.6 ± 0.2 μA; NR2A(2D-S2): 0.99 ± 0.04, 2.1 ± 0.6 μA; and NR2A(2D-S1S2): 1.48 ± 0.05, 1.9 ± 0.2 μA.
Figure 6
Figure 6. Summary of the pharmacological properties and ‘relative efficacies’ of ligands acting at the NR1 coagonist binding site for wild-type and chimeric NMDARs
Mean EC50 and Hill slope values obtained from fitting concentration–response relationships for a series of NR1 agonists acting at wild-type and chimeric NMDARs. Efficacy denotes the maximal current response to the test agonist relative to the maximal response to glycine. The ratio of the EC50 at NR1/NR2A(2D-S1S2) compared to NR1/NR2D NMDARs is given to indicate the extent to which incorporation of the S1 and S2 regions from the NR2D NMDAR subunit results in a more ‘NR2D-like’ agonist potency. For comparison the ratio of EC50 at NR1/NR2A to NR1/NR2D NMDARs is indicated in parentheses. The dependence of the EC50 for each agonist at the various constructs is illustrated as bar graphs to the right of these ratios.
Figure 5
Figure 5. Concentration–response curves for d-serine,β-fluoro-dl-alanine and ACPC acting at wild-type and chimeric NMDARs
A, mean concentration–response curves for d-serine acting at NR1/NR2A(WT) and NR1/NR2D(WT) NMDARs as well as each of the three chimeric NMDARs. B, mean concentration–response curves for β-fluoro-dl-alanine. C, mean concentration–response curves for ACPC. For each agonist, replacing the S1 and S2 region of the NR2A subunit with the corresponding regions from the NR2D subunit resulted in an increase in agonist potency. Mean EC50, Hill slope and ‘relative efficacy’ values for each of the agonists acting at the various NMDAR combinations are given in Fig. 6.
Figure 7
Figure 7. Antagonism of wild-type and chimeric NMDAR mediated responses by 5,7-DCKA
A, representative TEVC current recording of the inhibition by 5,7-DCKA of a NR1/NR2A(WT) NMDAR-mediated response. In this recording the glycine concentration was set to be equal to the EC50 concentration at this receptor combination (1.5 μm) whereas the glutamate concentration was set at a saturating level (50 μm). B, mean inhibition curves for 5,7-DCKA antagonism of responses mediated by NR1/NR2A(WT) and NR1/NR2D(WT) NMDARs and each of the three ‘binding’ domain chimeric NMDARs. C–E, Schild analysis of 5,7-DCKA antagonism. The mean dose ratios, r, measured from the parallel shifts of two-point concentration–response curves (Supplemental Fig. 4) are plotted on a log–log scale as (r– 1) versus antagonist concentration, [B]. If the slope of the linear regression fit of the data points was sufficiently close to 1 (as is to be expected of competitive antagonism), the data were refitted with the Schild equation (r– 1) =[B]/KB, where the slope of the line is unity and the equilibrium constant for antagonist binding, KB, is given by the intercept on the x-axis. Similar KB values for 5,7-DCKA were obtained for NR2A(WT), NR2D(WT) and NR2A(2D-S1S2) NMDARs.
Figure 8
Figure 8. Comparison of NR1/NR2A and NR1/NR2D glycine binding pockets and identification of NR2 residues that influence glycine potency
A, superimposition of NR1/NR2A (grey) and NR1/NR2D (purple) agonist binding domain dimers. The locations of the glutamate and glycine binding sites are highlighted by the yellow dashed-line boxes, with the glycine binding site shown in greater detail in panel B. The blue and red dashed-line boxes highlight the regions in the NR2A and NR2D D2 domains that are shown in greater detail in C and D, respectively. B, expanded view of the NR1 glycine binding site when associated with NR2A (grey) or NR2D (purple) showing that despite different potencies, both protein backbone and sidechains of the glycine binding site are predicted to be quite similar after 10 ns of simulation. C, illustration of the locations of Lys719 (NR2A, orange) and Met740 (NR2D, light green) in Domain2 of each NR2 NMDAR subunit. These residues are distant from the NR1–NR2 interface (indicated by the blue dashed-line box in A seen from a different orientation). Likewise, the carboxylate group of glutamate (when it occupies its binding site) and Lys719 are separated by more than 10 Å. D, illustration of the locations of Tyr735 (NR2A, orange) and Lys756 (NR2D, green) in Domain2 of each NR2 NMDAR subunit, positioned in the lower interface between NR1 and NR2 (indicated by the red dashed-line box in A seen from a different orientation).
Figure 9
Figure 9. Analysis of the effects of point mutations in the S2 region of the NR2A subunit on glycine potency
A, view of the NR1/NR2A agonist binding domain dimer. The positions of glycine and glutamate in their respective binding sites are indicated, together with the Tyr735 residue located in Domain2 of NR2A. B, a frame from the MD simulation of NR1/NR2A agonist binding domain dimer showing the hydrogen–bond interactions of Tyr735 in the NR2A subunit with residues Glu786 and Lys790 in the NR1 subunit and Tyr679 of NR2A. The location of glutamate in its binding site is also indicated. C, example TEVC current trace obtained in responses to applications of increasing concentrations of glycine (0.01–10 μm) and recorded from an oocyte expressing NR1/NR2A(K791M Y735K) NMDARs. D, mean glycine concentration–response curves for NR1/NR2A(K719M), NR1/NR2A(Y735K) and NR1/NR2A(K719M Y735K) NMDARs. Each of the point mutations result in a shift to the left in glycine potency to values that are similar to those seen for NR2D(WT)-containing NMDARs. Mean Hill slopes and mean maximal currents recorded were for NR2A(K719M): 1.08 ± 0.02, 1.9 ± 0.1 μA; for NR2A(Y735K): 1.05 ± 0.04, 3.0 ± 0.2 μA; and for NR2A(K719M Y735K): 1.16 ± 0.02, 3.8 ± 0.3 μA. The dashed and dotted lines show the corresponding glycine concentration–response curve for NR2A(WT)- and NR2D(WT)-containing NMDARs, respectively.
Figure 10
Figure 10. Analysis of the effects of point mutations in the S2 region of the NR2D subunit on glycine potency
A, view of the NR1/NR2D agonist binding domain dimer The positions of glycine and glutamate in their respective binding sites are indicated, together with the Lys756 residue located in Domain2 of NR2D. B, a frame from the MD simulation of NR1/NR2D agonist binding domain dimer showing the hydrogen bonding between Lys756 in the NR2D subunit and residues Glu786 in the NR1 subunit and Val757 of NR2D. The location of glutamate in its binding site is also indicated. C, example TEVC current trace obtained in responses to applications of increasing concentrations of glycine (0.01–3 μm) and recorded from an oocyte expressing NR1/NR2D(K756Y) NMDARs. Note that the initial response is obtained in the presence of no added glycine. Such recordings were used to estimate the levels of ‘contaminating’ glycine in our recording solutions. D, mean glycine concentration–response curve for NR1/NR2D(M740K) and NR1/NR2D(K756Y) NMDARs. The NR2D(M740K) mutation causes no change in glycine potency compared to NR2D(WT). Mean Hill slopes and mean maximal currents recorded for NR2D(M740K): 1.23 ± 0.06, 0.35 ± 0.15 μA. In contrast the NR2D(K756Y) mutation resulted in an increase in glycine potency. Mean Hill slopes and mean maximal currents recorded for NR2D(K756Y): 0.99 ± 0.04, 0.48 ± 0.09 μA. The dashed line shows the corresponding glycine concentration–response curve for NR2D(WT)-containing NMDARs.

Similar articles

Cited by

References

    1. Anson LC, Chen PE, Wyllie DJA, Colquhoun D, Schoepfer R. Identification of amino acid residues of the NR2A subunit that control glutamate potency in recombinant NR1/NR2A NMDA receptors. J Neurosci. 1998;18:581–589. - PMC - PubMed
    1. Anson LC, Schoepfer R, Colquhoun D, Wyllie DJA. Single-channel analysis of an NMDA receptor possessing a mutation in the region of the glutamate binding site. J Physiol. 2000;527:225–237. - PMC - PubMed
    1. Arunlakshana O, Schild HO. Some quantitative uses of drug antagonists. Br J Pharmacol Chemother. 1959;14:48–57. - PMC - PubMed
    1. Banke TG, Traynelis SF. Activation of NR1/NR2B NMDA receptors. Nat Neurosci. 2003;6:144–152. - PubMed
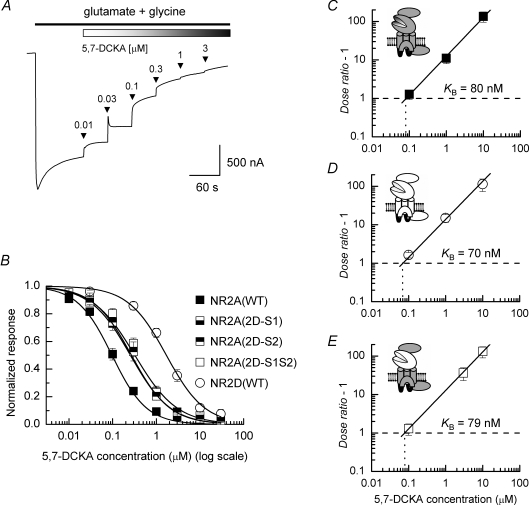
    1. Baron BM, Harrison BL, Miller FP, McDonald IA, Salituro FG, Schmidt CJ, Sorensen SM, White HS, Palfreyman MG. Activity of 5,7-dichlorokynurenic acid, a potent antagonist at the N-methyl-D-aspartate receptor-associated glycine binding site. Mol Pharmacol. 1990;38:554–561. - PubMed

Publication types

MeSH terms

LinkOut - more resources