

Mg2+ and memantine block of rat recombinant NMDA receptors containing chimeric NR2A/2D subunits expressed in Xenopus laevis oocytes
- PMID: 17962329
- PMCID: PMC2375557
- DOI: 10.1113/jphysiol.2007.143164
Mg2+ and memantine block of rat recombinant NMDA receptors containing chimeric NR2A/2D subunits expressed in Xenopus laevis oocytes
Abstract
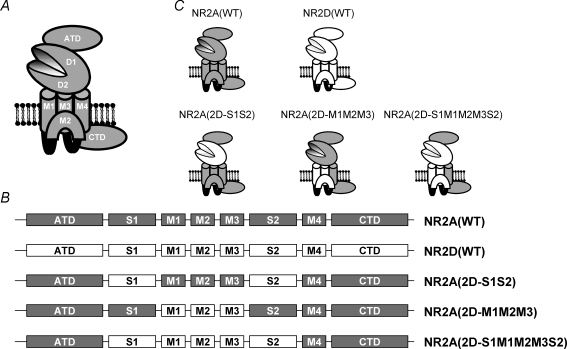
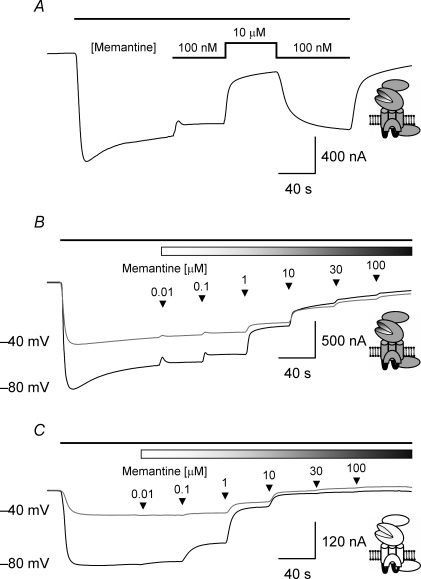
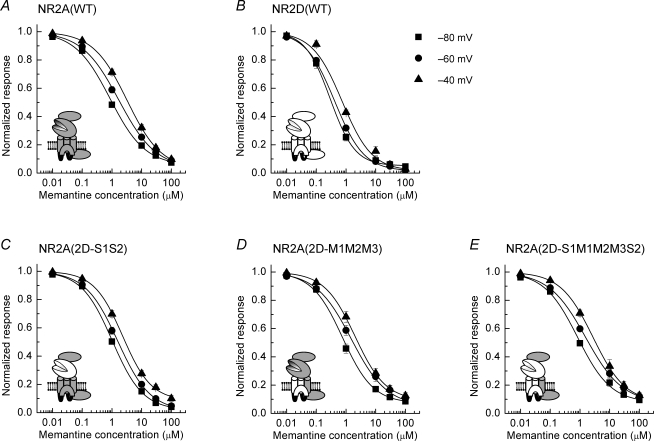
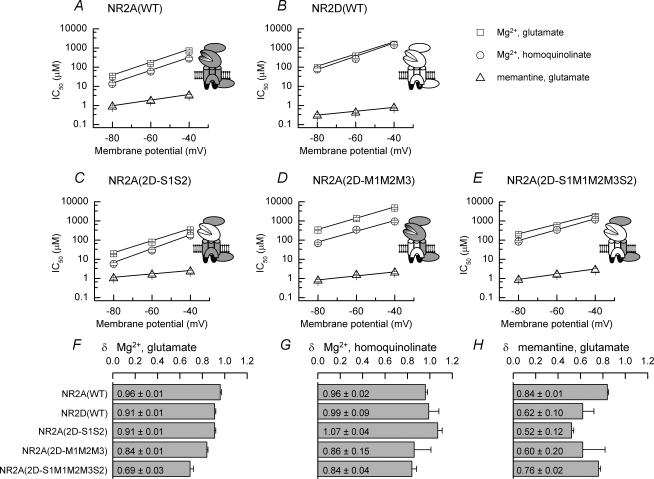
N-methyl-d-aspartate receptors (NMDARs) display differences in their sensitivity to the channel blockers Mg(2+) and memantine that are dependent on the identity of the NR2 subunit present in the receptor-channel complex. This study used two-electrode voltage-clamp recordings from Xenopus laevis oocytes expressing recombinant NMDARs to investigate the actions of Mg(2+) and memantine at the two NMDARs displaying the largest differences in sensitivity to these blockers, namely NR1/NR2A and NR1/NR2D NMDARs. In addition, NR2A/2D chimeric subunits have been employed to examine the effects of pore-forming elements and ligand-binding domains (LBD) on the potency of the block produced by each of these inhibitors. Our results show that, as previously documented, NR2D-containing NMDARs are less sensitive to voltage-dependent Mg(2+) block than their NR2A-containing counterparts. The reduced sensitivity is determined by the M1M2M3 membrane-associated regions, as replacing these regions in NR2A subunits with those found in NR2D subunits results in a approximately 10-fold reduction in Mg(2+) potency. Intriguingly, replacing the NR2A LBD with that from NR2D subunits results in a approximately 2-fold increase in Mg(2+) potency. Moreover, when responses mediated by NR1/NR2A NMDARs are evoked by the partial agonist homoquinolinate, rather than glutamate, Mg(2+) also displays an increased potency. Memantine block of glutamate-evoked currents is most potent at NR1/NR2D NMDARs, but no differences are observed in its ability to inhibit NR2A-containing or NR2A/2D chimeric NMDARs. We suggest that the potency of block of NMDARs by Mg(2+) is influenced not only by pore-forming regions but also the LBD and the resulting conformational changes that occur following agonist binding.
Figures


Similar articles
-
Modulation of glycine potency in rat recombinant NMDA receptors containing chimeric NR2A/2D subunits expressed in Xenopus laevis oocytes.J Physiol. 2008 Jan 1;586(1):227-45. doi: 10.1113/jphysiol.2007.143172. Epub 2007 Oct 25. J Physiol. 2008. PMID: 17962328 Free PMC article.
-
Pharmacological characterization of recombinant NR1/NR2A NMDA receptors with truncated and deleted carboxy termini expressed in Xenopus laevis oocytes.Br J Pharmacol. 2009 Feb;156(3):509-18. doi: 10.1111/j.1476-5381.2008.00040.x. Epub 2009 Jan 16. Br J Pharmacol. 2009. PMID: 19154422 Free PMC article.
-
Pharmacological heterogeneity of NMDA receptors: characterization of NR1a/NR2D heteromers expressed in Xenopus oocytes.Eur J Pharmacol. 1997 Feb 5;320(1):87-94. doi: 10.1016/s0014-2999(96)00880-1. Eur J Pharmacol. 1997. PMID: 9049607
-
Subunit-specific agonist activity at NR2A-, NR2B-, NR2C-, and NR2D-containing N-methyl-D-aspartate glutamate receptors.Mol Pharmacol. 2007 Oct;72(4):907-20. doi: 10.1124/mol.107.037333. Epub 2007 Jul 10. Mol Pharmacol. 2007. PMID: 17622578
-
N-[2-(N-(2-mercaptoethyl)) amino ethyl]-N-(2-mercaptoethyl)-3,5-dimethylacetamide amantadine-technetium.2012 Jun 12 [updated 2012 Jul 17]. In: Molecular Imaging and Contrast Agent Database (MICAD) [Internet]. Bethesda (MD): National Center for Biotechnology Information (US); 2004–2013. 2012 Jun 12 [updated 2012 Jul 17]. In: Molecular Imaging and Contrast Agent Database (MICAD) [Internet]. Bethesda (MD): National Center for Biotechnology Information (US); 2004–2013. PMID: 22812023 Free Books & Documents. Review.
Cited by
-
Potential of Medicinal Plants as Neuroprotective and Therapeutic Properties Against Amyloid-β-Related Toxicity, and Glutamate-Induced Excitotoxicity in Human Neural Cells.Curr Neuropharmacol. 2021;19(9):1416-1441. doi: 10.2174/1570159X19666210412095251. Curr Neuropharmacol. 2021. PMID: 33845746 Free PMC article. Review.
-
GluN2B subunit-containing NMDA receptor antagonists prevent Abeta-mediated synaptic plasticity disruption in vivo.Proc Natl Acad Sci U S A. 2009 Dec 1;106(48):20504-9. doi: 10.1073/pnas.0908083106. Epub 2009 Nov 16. Proc Natl Acad Sci U S A. 2009. PMID: 19918059 Free PMC article.
-
Selective inhibition of GluN2D-containing N-methyl-D-aspartate receptors prevents tissue plasminogen activator-promoted neurotoxicity both in vitro and in vivo.Mol Neurodegener. 2011 Oct 5;6:68. doi: 10.1186/1750-1326-6-68. Mol Neurodegener. 2011. PMID: 21975018 Free PMC article.
-
A Frameshift Variant of GluN2A Identified in an Epilepsy Patient Results in NMDA Receptor Mistargeting.J Neurosci. 2024 Jan 24;44(4):e0557232023. doi: 10.1523/JNEUROSCI.0557-23.2023. J Neurosci. 2024. PMID: 38050135 Free PMC article.
-
Direct pharmacological monitoring of the developmental switch in NMDA receptor subunit composition using TCN 213, a GluN2A-selective, glycine-dependent antagonist.Br J Pharmacol. 2012 Jun;166(3):924-37. doi: 10.1111/j.1476-5381.2011.01748.x. Br J Pharmacol. 2012. PMID: 22022974 Free PMC article.
References
-
- Blanpied TA, Boeckman FA, Aizenman E, Johnson JW. Trapping channel block of NMDA-activated responses by amantadine and memantine. J Neurophysiol. 1997;77:309–323. - PubMed
Publication types
MeSH terms
Substances
Grants and funding
LinkOut - more resources
Full Text Sources