Comparative Study
. 2008 Jan;149(1):193-207.
doi: 10.1210/en.2007-1259. Epub 2007 Oct 25.

Cell proliferation and expression of cell cycle regulatory proteins that control the G1/S transition are age dependent and lobe specific in the Brown Norway rat model of prostatic hyperplasia

Affiliations
Comparative Study

Cell proliferation and expression of cell cycle regulatory proteins that control the G1/S transition are age dependent and lobe specific in the Brown Norway rat model of prostatic hyperplasia

Jinchun Yan et al. Endocrinology. 2008 Jan.

Abstract

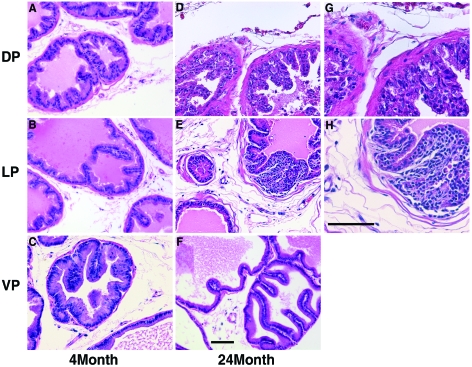
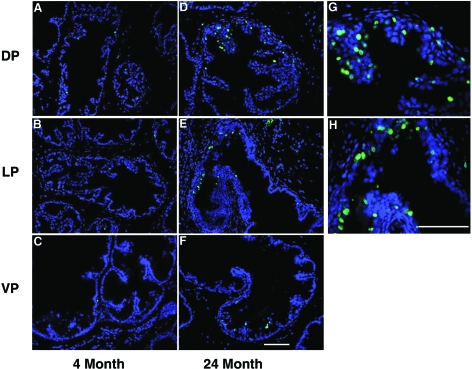
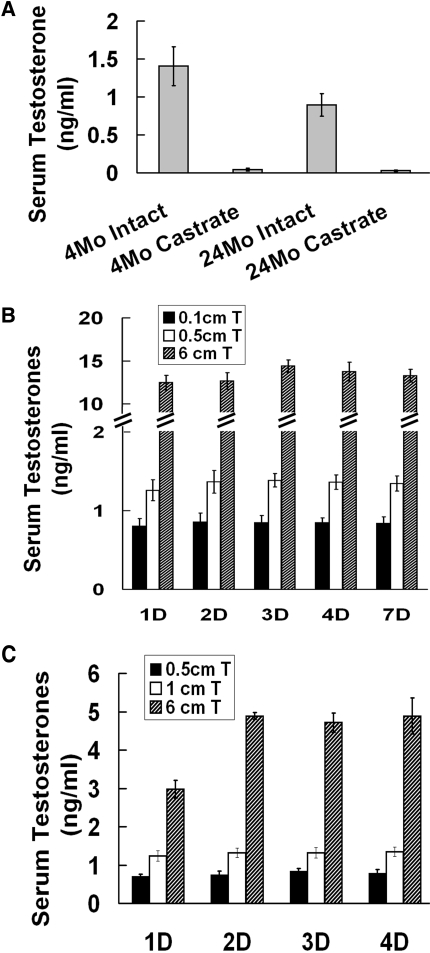
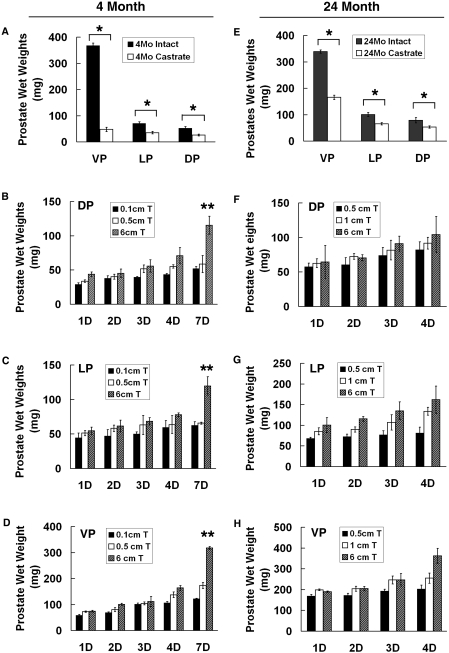
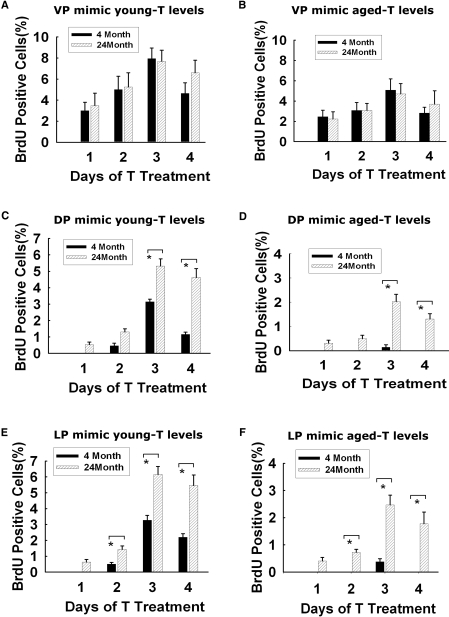
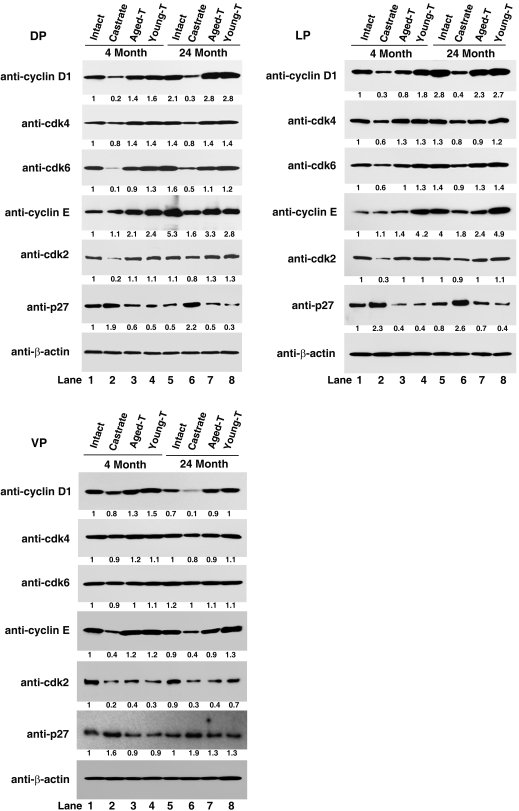
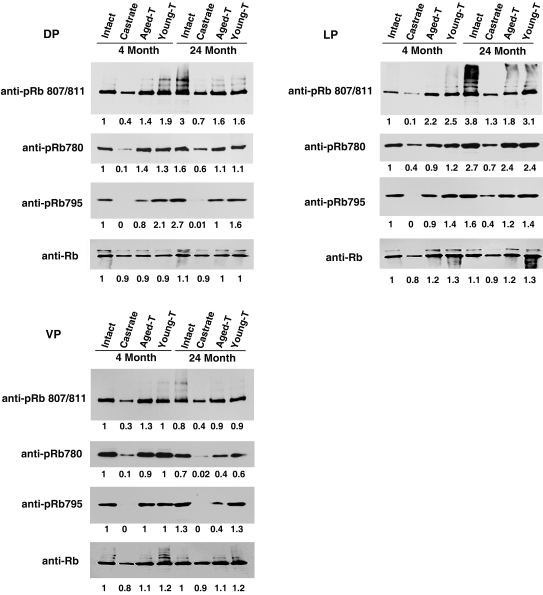
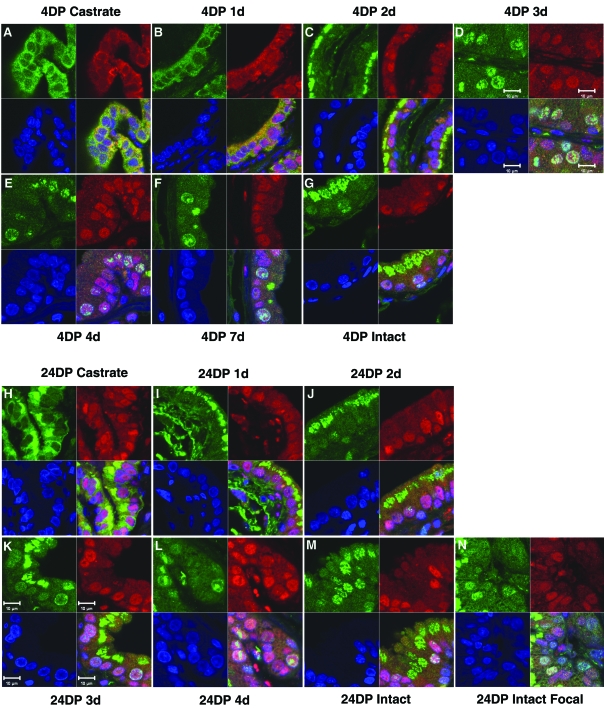
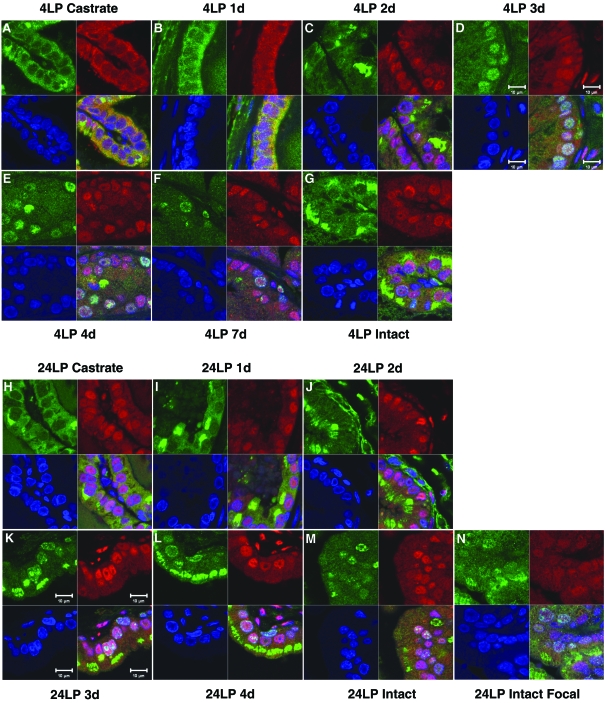
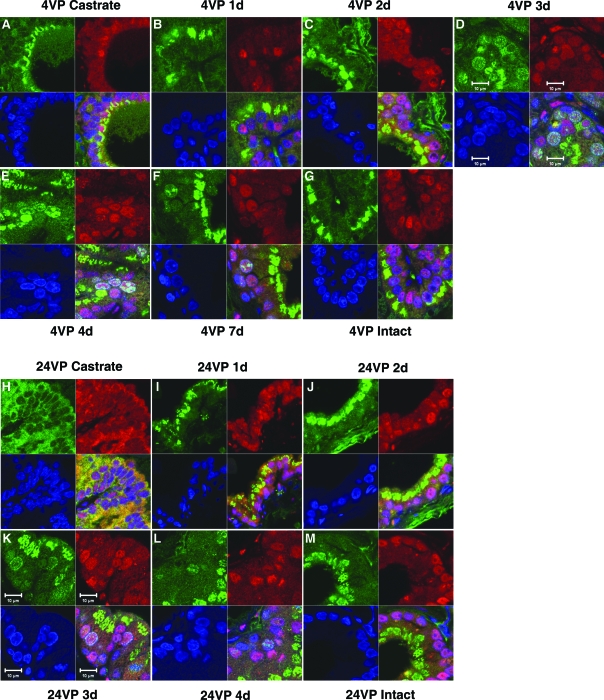
Age-dependent epithelial cell hyperplasia in the dorsal and lateral lobes of Brown Norway rats is analogous to benign prostatic hyperplasia in aging men. A major question is whether differential lobe-specific and age-dependent proliferation of cells, rather than cell survival, contributes to the hyperplasia. Although serum testosterone (T) levels decline in aged rats, active cell proliferation was detected as Ki67-positive cells in the dorsal and lateral lobes. We determined whether androgens differentially affect cell proliferation and cell-cycle regulatory proteins in the prostate lobes of young and aged rats. Castrated rats were treated with different doses of T to restore serum levels to those of intact young or aged rats. Rates of cell proliferation, measured by 5-bromodeoxyuridine labeling, peaked after 3-d T treatment in all lobes. 5-bromodeoxyuridine-labeling indices were higher in the dorsal and lateral lobes of aged than of young rats with equivalent serum T levels. No age-dependent difference was seen in the ventral lobe. Cell proliferation was marked by increased levels of cyclins D1 and E and cyclin-dependent kinases 4 and 6, decreased p27 and increased phosphorylation of Rb. Levels of cyclins D1 and E were higher in the dorsal and lateral lobes of intact and T-treated aged than young rats. Confocal immunofluorescent microscopy documented changes in cyclin-dependent kinase 4 and cyclin D1 subcellular localization. Cyclin D1 nuclear localization correlated with the time frame for cell proliferation. In conclusion, rates of cell proliferation and levels of cell-cycle regulatory proteins that control the G1/S transition exhibit lobe-specific and age-dependent differences in response to androgens.


Figures

Figure 1
Figure 1
Morphology of prostate lobes in 4- and 24-month-old Brown Norway rats. Representative tissue sections from the dorsal (DP), lateral (LP), and ventral (VP) prostate lobes were stained with hematoxylin and eosin to illustrate the histological changes in prostate morphology that occur in rats between 4 and 24 months of age. The dorsal, lateral, and ventral prostate lobes from 4-month-old rats are shown in panels A–C, respectively (magnification, ×200). The dorsal, lateral, and ventral prostate lobes from 24-month-old rats are shown in panels D–F, respectively (magnification, ×200). Higher magnification (×400) images from the dorsal and lateral prostate lobes of 24-month-old rats are shown in panels G and H, respectively, to highlight the obvious presence of hyperplasia of epithelial cells. Bar, 100 μm.
Figure 2
Figure 2
Immunofluorescent detection of Ki67 in prostate lobes of 4- and 24-month-old Brown Norway rats. Expression of the biomarker, Ki67, of cell proliferation in tissue sections from the dorsal (DP), lateral (LP), and ventral (VP) prostate lobes was identified by immunofluorescent microscopy. Specific Ki67 (green) immunofluorescent staining was detected in the nuclei of cells as the cyan merged signal in the presence of DAPI (blue) nuclear counterstain. Few Ki67 positive nuclei were detected in the dorsal, lateral, and ventral prostate lobes from 4-month-old rats shown in panels A–C, respectively (magnification, ×200). Focal hot spots of Ki67 positive nuclei consistent with areas of epithelial cell hyperplasia were detected in the dorsal in panels D (magnification, ×200) and G (×400), and in the lateral prostate lobes in panels E (×200) and H (×400), but not in the ventral prostate lobes in panel F (×200) from 24-month-old rats. Bar, 100 μm.
Figure 3
Figure 3
Serum T levels in intact, castrated, and T-treated 4- and 24-month (Mo)-old Brown Norway rats. T concentrations in serum collected from 4- and 24-month-old Brown Norway rats were measured by RIA. Age-dependent serum T concentrations in intact control rats and 14 d after castration in rats of both ages are shown in panel A. Castrated 4- (panel B) and 24-month rats (panel C) were implanted with T-filled SILASTIC brand capsules of 0.1, 0.5, 1.0, or 6.0 cm in length for 1, 2, 3, 4, or 7 d, and serum T concentrations were determined at the time of prostate tissue collection. Mean serum T concentrations are expressed as ng/ml ± sem (n = 6 rats per group).
Figure 4
Figure 4
Tissue weights of each prostate lobe from intact, castrated, and T-treated 4- and 24-month (Mo)-old Brown Norway rats. Individual prostate lobe weights are shown for 4- (panels A–D) and 24-month-old rats (panels E–H). The weights of the ventral (VP), lateral (LP), and dorsal (DP) lobes are shown for intact and 14-d castrated rats of 4 and 24 months of age in panels A and E, respectively. The weights of the dorsal, lateral, and ventral lobes are shown in panels B–D, respectively, for 4-month-old castrated rats treated with 0.1, 0.5, or 6.0 cm T-filled capsules for 1, 2, 3, 4, or 7 d. The weights of the dorsal, lateral, and ventral lobes are shown in panels F–H, respectively, for 24-month-old castrated rats treated with 0.5, 1.0, or 6.0 cm T-filled capsules for 1, 2, 3, or 4 d. Tissue weights are expressed as mg wet weight/lobe ± sem (n = 6 rats per group). *, Significantly different from intact control (P < 0.05). **, Significantly different all other T-treated groups (P < 0.05).
Figure 5
Figure 5
Time course and rates of epithelial cell proliferation in the prostate lobes of 4- and 24-month-old castrated Brown Norway rats after T treatment. Castrated rats of 4 (solid bars) and 24 months of age (stippled bars) were implanted with T-filled capsules to establish serum T concentrations equivalent to the endogenous levels of T normally present in the blood of 4- (young-T; left column panels) and 24-month-old rats (aged-T; right column panels). Rats were injected with the thymidine analog, BrdU, 1 h before euthanasia to allow the incorporation of BrdU into newly synthesized DNA in replicating cells. BrdU-positive nuclei were detected by immunofluorescent detection of BrdU, and the total number of nuclei was quantified using DAPI staining. The rates of epithelial cell proliferation were determined from the BrdU-LI (number of BrdU-positive epithelial cell nuclei per total number of luminal epithelial cell nuclei × 100%) at 1, 2, 3, and 4 d during T treatment. Data are expressed as the percentage of BrdU-positive epithelial cells ± sem (n = 3 animals per group). *, Significantly different for 4- and 24-month-old rats (P < 0.05). DP, Dorsal prostate; LP, lateral prostate; VP, ventral prostate.
Figure 6
Figure 6
Immunoblots of cyclins, cdks, and p27 proteins in the prostate lobes from intact, castrated, and T-treated 4- and 24-month-old Brown Norway rats. Western blot analyses for levels of cyclin D1, cdk4, cdk6, cyclin E, cdk2, and p27 protein expression that regulate the G1/S cell cycle transition were conducted for the dorsal (DP) (upper-left panel), lateral (LP) (upper-right panel), and ventral (VP) (lower-left panel) prostate lobes from intact control, 14-d castrated, and castrated plus 3-d T-treated 4- and 24-month-old rats. Serum T levels were established to mimic the endogenous T levels in 24 (aged-T; ∼0.8 ng/ml) or 4-month-old rats (young-T; ∼1.5 ng/ml). β-Actin was used to show equal loading of protein in each lane. The numbers below individual lanes in each panel were calculated as the ratio of the intensity of each protein band to the intensity of the actin band; the ratio of the bands from the young intact control rats was set to 1.0, and values for all other lanes are represented relative to this value. Each sample was derived by pooling the prostate tissues from three animals within each experimental group. All results were replicated in two separate experiments.
Figure 7
Figure 7
Immunoblots of Rb protein, Rb, and its phosphorylated isoforms in the prostate lobes from intact, castrated, and T-treated 4- and 24-month-old Brown Norway rats. Protein expression levels of Rb and its serine residue specific phosphorylated isoforms were determined by Western blots using the protein fraction obtained after immunoprecipitation of total Rb protein using a Rb-specific antibody from tissue lysates normalized to contain 500 μg total protein of the dorsal (DP) (upper-left panel), lateral (LP) (upper-right panel), and ventral (VP) (lower-left panel) prostate lobes from intact control, 14-d castrated, and castrated plus 3-d T-treated 4- and 24-month-old rats. Serum T levels were established to mimic the endogenous T levels in 24 (aged-T; ∼0.8 ng/ml) or 4-month-old (young-T; ∼1.5 ng/ml) rats. The numbers below individual lanes in each panel were calculated as the ratio of the intensity of each protein band to the intensity of the actin band; the ratio of the bands from the young intact control rats was set to 1.0, and values for all other lanes are represented relative to this value. Each sample was derived by pooling the prostate tissues from three animals within each experimental group. All results were replicated in two separate experiments.
Figure 8
Figure 8
Immunofluorescent localization of cyclin D1 and cdk4 in epithelial cells of the dorsal prostate lobes from intact, castrated, and T-treated 4- and 24-month-old Brown Norway rats. Rats of 4 (top portion) and 24 months of age (bottom portion) were castrated, and the dorsal prostate (DP) was allowed to regress for 14 d (panels A and H), and subsequently treated with 0.5 cm (4 months old) or 1.0 cm (24 months old) T-filled capsules for 1 (panels B and I), 2 (panels C and J), 3 (panels D and K), 4 (panels E and L), or 7 d (panel F). The dorsal prostate from intact 4 (panel G, normal) and 24-month-old rats (panels M, normal, and N, focal hyperplasia) are also shown. Within panels A–N, confocal immunofluorescent microscopy was used to detect the cytoplasmic and nuclear localization of cyclin D1 (green; top-left corner) and cdk4 (red; top-right corner) along with the DAPI-stained nuclei (blue; bottom-left corner). The merged images are shown in the bottom right corner of each panel. Bar, 10 μm.
Figure 9
Figure 9
Immunofluorescent localization of cyclin D1 and cdk4 in epithelial cells of the lateral prostate lobes from intact, castrated, and T-treated 4- and 24-month-old Brown Norway rats. Rats of 4 (top portion) and 24 months of age (bottom portion) were castrated, and the lateral prostate (LP) was allowed to regress for 14 d (panels A and H), and subsequently treated with 0.5 cm (4 months old) or 1.0 cm (24 months old) T-filled capsules for 1 (panels B and I), 2 (panels C and J), 3 (panels D and K), 4 (panels E and L), or 7 d (panel F). The lateral prostate from intact 4 (panel G, normal) and 24-month-old rats (panel M, normal, and panel N, focal hyperplasia) are also shown. Within panels A–N, confocal immunofluorescent microscopy was used to detect the cytoplasmic and nuclear localization of cyclin D1 (green; top-left corner) and cdk4 (red; top-right corner), along with the DAPI-stained nuclei (blue; bottom-left corner). The merged images are shown in the bottom right corner of each panel. Bar, 10 μm.
Figure 10
Figure 10
Immunofluorescent localization of cyclin D1 and cdk4 in epithelial cells of the ventral prostate lobes from intact, castrated, and T-treated 4- and 24-month-old Brown Norway rats. Rats of 4 (top portion) and 24 months of age (bottom portion) were castrated, and the ventral prostate (VP) was allowed to regress for 14 d (panels A and H), and subsequently treated with 0.5 cm (4 months old) or 1.0 cm (24 months old) T-filled capsules for 1 (panels B and I), 2 (panels C and J), 3 (panels D and K), 4 (panels E and L), or 7 d (panel F). The ventral prostate from intact 4- and 24-month-old rats are shown in panels G and M, respectively. Within panels A–M, confocal immunofluorescent microscopy was used to detect the cytoplasmic and nuclear localization of cyclin D1 (green; top-left corner) and cdk4 (red; top-right corner), along with the DAPI-stained nuclei (blue; bottom-left corner). The merged images are shown in the bottom right corner of each panel. Bar, 10 μm.

Similar articles

Cited by

References

    1. Price D 1963 Comparative aspects of development and structure in the prostate. Natl Cancer Inst Monogr 12:351–369 - PubMed
    1. Banerjee PP, Banerjee S, Lai JM, Strandberg, JD, Zirkin BR and Brown TR 1998 Age-dependent and lobe-specific spontaneous hyperplasia in the Brown Norway rat prostate. Biol Reprod 59:1163–1170 - PubMed
    1. Roy AK, Lavrovsky Y, Song CS, Chen S, Jung MH, Velu NK, Bi BY, Chatterjee B 1999 Regulation of androgen action. Vitam Horm 55:309–352 - PubMed
    1. Isaacs JT 2005 New strategies for the medical treatment of prostate cancer. BJU Int 96(Suppl 2):35–40 - PubMed
    1. Cuellar DC, Kyprianou N 2001 Future concepts in the medical therapy of benign prostatic hyperplasia. Curr Opin Urol 11:27–33 - PubMed

Publication types

MeSH terms