. 2007 Nov;16(11):2472-82.
doi: 10.1110/ps.073037907.

The challenge of protein structure determination--lessons from structural genomics

Affiliations

The challenge of protein structure determination--lessons from structural genomics

Lukasz Slabinski et al. Protein Sci. 2007 Nov.

Abstract

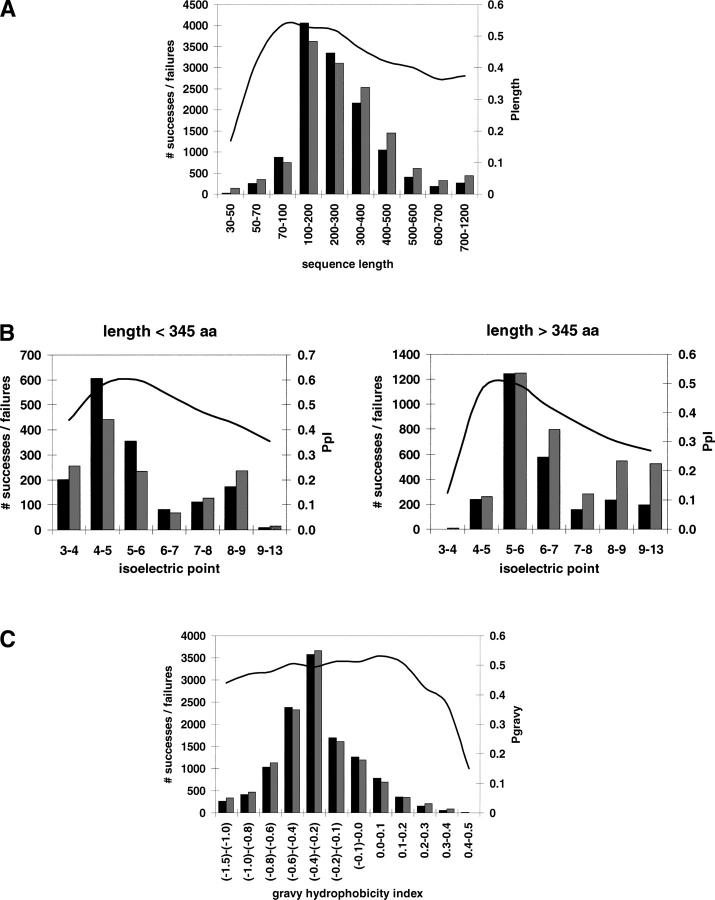
The process of experimental determination of protein structure is marred with a high ratio of failures at many stages. With availability of large quantities of data from high-throughput structure determination in structural genomics centers, we can now learn to recognize protein features correlated with failures; thus, we can recognize proteins more likely to succeed and eventually learn how to modify those that are less likely to succeed. Here, we identify several protein features that correlate strongly with successful protein production and crystallization and combine them into a single score that assesses "crystallization feasibility." The formula derived here was tested with a jackknife procedure and validated on independent benchmark sets. The "crystallization feasibility" score described here is being applied to target selection in the Joint Center for Structural Genomics, and is now contributing to increasing the success rate, lowering the costs, and shortening the time for protein structure determination. Analyses of PDB depositions suggest that very similar features also play a role in non-high-throughput structure determination, suggesting that this crystallization feasibility score would also be of significant interest to structural biology, as well as to molecular and biochemistry laboratories.


Figures

Figure 1.
Figure 1.
Observed distributions of successes and failures and calculated probabilities of successful protein production for (A) sequence length, (B) isoelectric point for short and long proteins, and (C) gravy hydrophobicity index. The number of successfully produced proteins in each bin are shown as black bars, and the number of proteins that failed in the production process are shown as gray bars (i.e., they are associated with the left vertical axis). The probability of protein production calculated as the fraction of successfully produced proteins for all proteins from the same bin is shown as a continuous line (i.e., it is associated with the right vertical axis).
Figure 2.
Figure 2.
Observed distributions of successes and failures and calculated probabilities of protein crystallization for (A) sequence length, (B) isoelectric point for short and long proteins, (C) gravy hydrophobicity index, (D) length of the longest disordered region, (E) protein instability index, (F) predicted content of coil structure, (G) predicted content of coiled-coil structures, and (H) insertions. The number of crystallized proteins in each bin are shown as black bars, and the number of proteins that failed to crystallize are shown as gray bars (i.e., they are associated with the left vertical axis). The probability of protein crystallization calculated as the fraction of successfully crystallized proteins for all proteins from a given bin is shown as a continuous line (i.e., it is associated with the right vertical axis).
Figure 3.
Figure 3.
(A) Success rate distributions of protein production for targets rank-ordered by production feasibility score S p = (P length * P pI * P GRAVY * P tm)1/4. Results of two jackknife tests applied to S p feasibility score are also shown. S ps is a success rate distribution obtained when S p feasibility score was based on the data from four large PSI centers (JCSG, MCSG, NESG, and NYSGXRC) and used to rank-order targets from all other centers (BSGC, BCGI, CESG, ISFI, OPPF, S2F, SECSG, SGPP, SPINE-EU, YSG, TB, and RSGI). For S pl distribution, the targets from the four large PSI centers were rank-ordered using S p feasibility score derived from the data from all other centers. The benchmark result, based on targets processed after our original analysis, is shown as S pb. Because tested sets have different average success rates (from 44%–51%), the normalized plot is shown as an inset. Production probability distribution obtained for OB-Score is shown for comparison (dotted line). (B) Distribution of targets into feasibility classes and observed numbers of successes and failures in protein production.
Figure 4.
Figure 4.
(A) Probability distributions of protein crystallization when targets were sorted by crystallization feasibility score S c = (P length * P pI * P GRAVY * P ldiso * P II * P coils * P cc * P tm * P ins)1/9. Results of two jackknife tests applied to S c feasibility score are also shown. S cs is a success rate distribution obtained when S c feasibility score was based on the data from four large PSI centers (JCSG, MCSG, NESG, and NYSGXRC) and used to rank-order targets from all other centers (BSGC, BCGI, CESG, ISFI, OPPF, S2F, SECSG, SGPP, SPINE-EU, YSG, TB, and RSGI). For S cl distribution, the targets from the four large PSI centers were rank-ordered using S c feasibility score derived from the data from all other centers. The benchmark result based on targets processed after our original analysis is shown as S cb. Because tested sets have different average success rates (from 33%–41%), the normalized plot is also shown. Crystallization probability distribution obtained for OB-Score is shown for comparison (dotted line). (B) Distribution of targets into feasibility classes and observed successes and failures in protein crystallization.
Figure 5.
Figure 5.
(A) Distributions of structural genomics structures determined via X-ray crystallography and via NMR between crystallization classes. (B) Distribution of structures solved via X-ray crystallography between crystallization classes in TargetDB and in PDB.

Similar articles

Cited by

References

    1. Bendtsen J.D., Nielsen, H., von Heijne, G., and Brunak, S. 2004. Improved prediction of signal peptides: SignalP 3.0. J. Mol. Biol. 340: 783–795. - PubMed
    1. Berman H.M., Westbrook, J., Feng, Z., Gilliland, G., Bhat, T.N., Weissig, H., Shindyalov, I.N., and Bourne, P.E. 2000. The Protein Data Bank. Nucleic Acids Res. 28: 235–242. - PMC - PubMed
    1. Bertone P., Kluger, Y., Lan, N., Zheng, D., Christendat, D., Yee, A., Edwards, A.M., Arrowsmith, C.H., Montelione, G.T., and Gerstein, M. 2001. SPINE: An integrated tracking database and data mining approach for identifying feasible targets in high-throughput structural proteomics. Nucleic Acids Res. 29: 2884–2898. - PMC - PubMed
    1. Canaves J.M., Page, R., Wilson, I.A., and Stevens, R.C. 2004. Protein biophysical properties that correlate with crystallization success in Thermotoga maritima: Maximum clustering strategy for structural genomics. J. Mol. Biol. 344: 977–991. - PubMed
    1. Chandonia J.M., Kim, S.H., and Brenner, S.E. 2006. Target selection and deselection at the Berkeley Structural Genomics Center. Proteins 62: 356–370. - PubMed

Publication types

LinkOut - more resources