

On the role of structural class of a protein with two-state folding kinetics in determining correlations between its size, topology, and folding rate
- PMID: 17962408
- PMCID: PMC2211710
- DOI: 10.1110/ps.073124507
On the role of structural class of a protein with two-state folding kinetics in determining correlations between its size, topology, and folding rate
Abstract
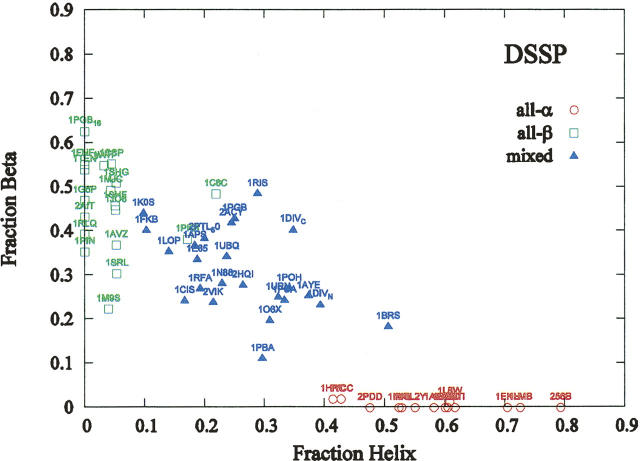
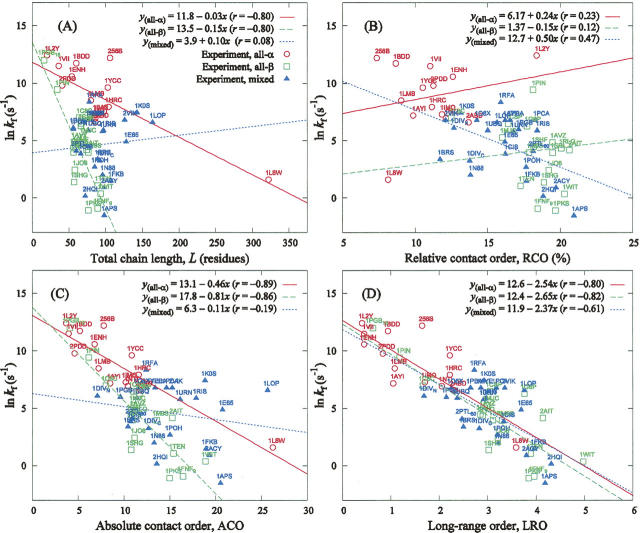
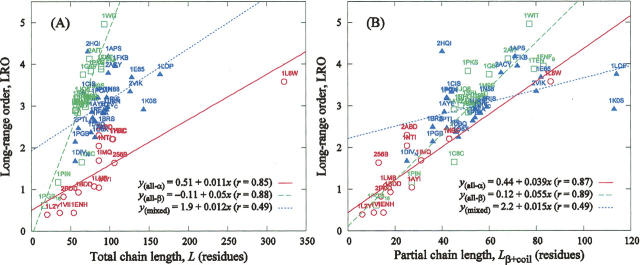
The time it takes for proteins to fold into their native states varies over several orders of magnitude depending on their native-state topology, size, and amino acid composition. In a number of previous studies, it was found that there is strong correlation between logarithmic folding rates and contact order for proteins that fold with two-state kinetics, while such correlation is absent for three-state proteins. Conversely, strong correlations between folding rates and chain length occur within three-state proteins, but not in two-state proteins. Here, we demonstrate that chain lengths and folding rates of two-state proteins are not correlated with each other only when all-alpha, all-beta, and mixed-class proteins are considered together, which is typically the case. However, when considering all-alpha and all-beta two-state proteins separately, there is significant linear correlation between folding rate and size. Moreover, the sets of data points for the all-alpha and all-beta classes define asymptotes of lower and upper limits on folding rates of mixed-class proteins. By analyzing correlation of other topological parameters with folding rates of two-state proteins, we find that only the long-range order exhibits correlation with folding rates that is uniform over all three classes. It is also the only descriptor to provide statistically significant correlations for each of the three structural classes. We give an interpretation of this observation in terms of Makarov and Plaxco's diffusion-based topomer-search model.
Figures
References
-
- Galzitskaya O.V. and Garbuzynskiy, S.O. 2006. Entropy capacity determines protein folding. Proteins 63: 144–154. - PubMed
-
- Galzitskaya O.V., Garbuzynskiy, S.O., Ivankov, D.N., and Finkelstein, A.V. 2003. Chain length is the main determinant of the folding rate for proteins with three-state folding kinetics. Proteins 51: 162–166. - PubMed
-
- Gong H., Isom, D.G., Srinivasan, R., and Rose, G.D. 2003. Local secondary structure content predicts folding rates of simple, two-state proteins. J. Mol. Biol. 327: 1149–1154. - PubMed
-
- Grantcharova V., Alm, E.J., Baker, D., and Horwich, A.L. 2001. Mechanisms of protein folding. Curr. Opin. Struct. Biol. 11: 70–72. - PubMed
-
- Gromiha M.M. 2003. Importance of native-state topology for determining the folding rate of two-state proteins. J. Chem. Inf. Comput. Sci. 43: 1481–1485. - PubMed
Publication types
MeSH terms
Substances
Grants and funding
LinkOut - more resources
Full Text Sources
