

Galpha Gbetagamma dissociation may be due to retraction of a buried lysine and disruption of an aromatic cluster by a GTP-sensing Arg Trp pair
- PMID: 17962409
- PMCID: PMC2211685
- DOI: 10.1110/ps.073098107
Galpha Gbetagamma dissociation may be due to retraction of a buried lysine and disruption of an aromatic cluster by a GTP-sensing Arg Trp pair
Abstract
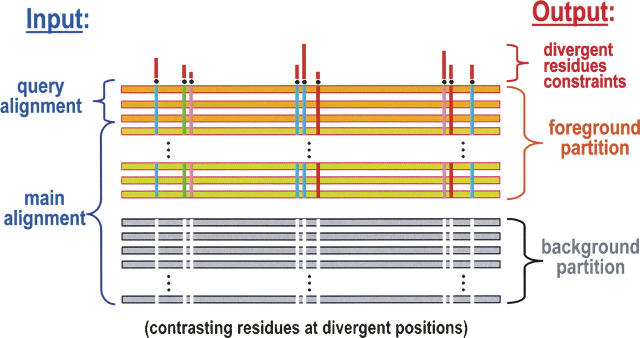
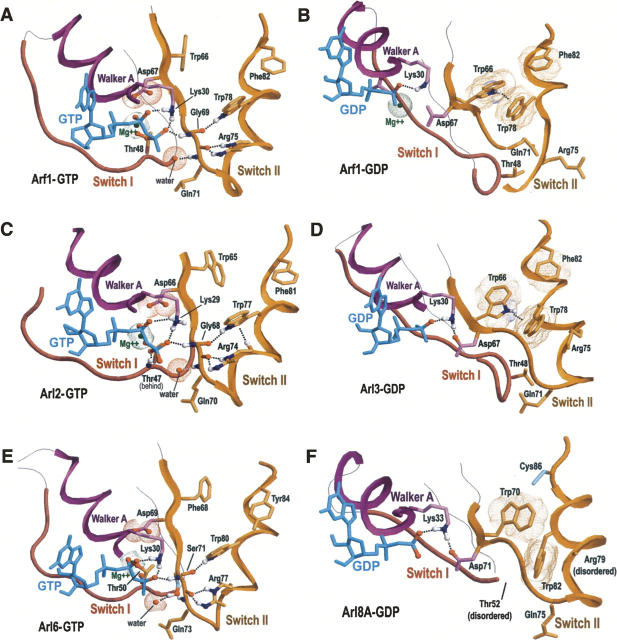
The heterotrimeric G protein alpha subunit (Galpha) functions as a molecular switch by cycling between inactive GDP-bound and active GTP-bound states. When bound to GDP, Galpha interacts with high affinity to a complex of the beta and gamma subunits (Gbetagamma), but when bound to GTP, Galpha dissociates from this complex to activate downstream signaling pathways. Galpha's state is communicated to other cellular components via conformational changes within its switch I and II regions. To identify key determinants of Galpha's function as a signaling pathway molecular switch, a Bayesian approach was used to infer the selective constraints that most distinguish Galpha and closely related Arf family GTPases from distantly related translational and metabolic GTPases. The strongest of these constraints are imposed on seven residues within or near the switch II region. Likewise, constraints imposed on Galpha but not on other, closely related molecular switches correspond to four nearby residues. These constraints are explained by a proposed mechanism for GTP-induced dissociation of Galpha from Gbetagamma where an Arg-Trp pair senses the presence of bound GTP leading to conformational retraction of a nearby lysine and to disruption of an aromatic cluster. Within a complex of Gialpha, Gibetagamma, and GDP, this lysine establishes greater surface contact with Gibeta than does any other residue in Gialpha, whereas the aromatic cluster packs against a highly conserved tryptophan in Gibeta that establishes greater surface contact with Gialpha than does any other residue in Gibeta. Other structural features associated with Galpha functional divergence further support the proposed mechanism.
Figures


Similar articles
-
Invited review: Activation of G proteins by GTP and the mechanism of Gα-catalyzed GTP hydrolysis.Biopolymers. 2016 Aug;105(8):449-62. doi: 10.1002/bip.22836. Biopolymers. 2016. PMID: 26996924 Free PMC article. Review.
-
Evidence for a second, high affinity Gbetagamma binding site on Galphai1(GDP) subunits.J Biol Chem. 2009 Jun 19;284(25):16906-16913. doi: 10.1074/jbc.M109.006585. Epub 2009 Apr 15. J Biol Chem. 2009. PMID: 19369247 Free PMC article.
-
Targeting G protein-coupled receptor signaling at the G protein level with a selective nanobody inhibitor.Nat Commun. 2018 May 18;9(1):1996. doi: 10.1038/s41467-018-04432-0. Nat Commun. 2018. PMID: 29777099 Free PMC article.
-
Structural and molecular characterization of a preferred protein interaction surface on G protein beta gamma subunits.Biochemistry. 2005 Aug 9;44(31):10593-604. doi: 10.1021/bi050655i. Biochemistry. 2005. PMID: 16060668
-
The GAPs, GEFs, and GDIs of heterotrimeric G-protein alpha subunits.Int J Biol Sci. 2005;1(2):51-66. doi: 10.7150/ijbs.1.51. Epub 2005 Apr 1. Int J Biol Sci. 2005. PMID: 15951850 Free PMC article. Review.
Cited by
-
Bayesian classification of residues associated with protein functional divergence: Arf and Arf-like GTPases.Biol Direct. 2010 Dec 3;5:66. doi: 10.1186/1745-6150-5-66. Biol Direct. 2010. PMID: 21129209 Free PMC article.
-
Discovery of Novel DENN Proteins: Implications for the Evolution of Eukaryotic Intracellular Membrane Structures and Human Disease.Front Genet. 2012 Dec 13;3:283. doi: 10.3389/fgene.2012.00283. eCollection 2012. Front Genet. 2012. PMID: 23248642 Free PMC article.
-
Rapid detection, classification and accurate alignment of up to a million or more related protein sequences.Bioinformatics. 2009 Aug 1;25(15):1869-75. doi: 10.1093/bioinformatics/btp342. Epub 2009 Jun 8. Bioinformatics. 2009. PMID: 19505947 Free PMC article.
-
Inference of Functionally-Relevant N-acetyltransferase Residues Based on Statistical Correlations.PLoS Comput Biol. 2016 Dec 21;12(12):e1005294. doi: 10.1371/journal.pcbi.1005294. eCollection 2016 Dec. PLoS Comput Biol. 2016. PMID: 28002465 Free PMC article.
-
Trp fluorescence reveals an activation-dependent cation-pi interaction in the Switch II region of Galphai proteins.Protein Sci. 2009 Nov;18(11):2326-35. doi: 10.1002/pro.243. Protein Sci. 2009. PMID: 19760664 Free PMC article.
References
-
- Amor J.C., Harrison, D.H., Kahn, R.A., and Ringe, D. 1994. Structure of the human ADP-ribosylation factor 1 complexed with GDP. Nature 372: 704–708. - PubMed
-
- Atanassova A., Tempel, W., Dimov, S., Yaniw, D., Arrowsmith, C., Edwards, A., Sundstrom, M., Weigelt, J., Bochkarev, A., and Park, H. 2006. Structure of human Adp-ribosylation factor-like 10b (Arl10b). Structural Genomics Consortium, Toronto, Canada.
-
- Berghuis A.M., Lee, E., Raw, A.S., Gilman, A.G., and Sprang, S.R. 1996. Structure of the GDP–Pi complex of Gly203 → Ala giα1: A mimic of the ternary product complex of gα-catalyzed GTP hydrolysis. Structure 4: 1277–1290. - PubMed
-
- Burd C.G., Strochlic, T.I., and Gangi Setty, S.R. 2004. Arf-like GTPases: Not so Arf-like after all. Trends Cell Biol. 14: 687–694. - PubMed
Publication types
MeSH terms
Substances
Grants and funding
LinkOut - more resources
Full Text Sources
Molecular Biology Databases
