. 2007 Nov 6;104(45):17692-7.
doi: 10.1073/pnas.0707045104. Epub 2007 Oct 25.

Gata2, Fli1, and Scl form a recursively wired gene-regulatory circuit during early hematopoietic development

Affiliations

Gata2, Fli1, and Scl form a recursively wired gene-regulatory circuit during early hematopoietic development

John E Pimanda et al. Proc Natl Acad Sci U S A. .

Abstract

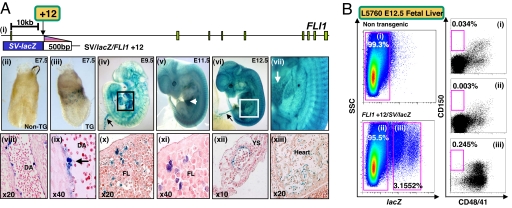
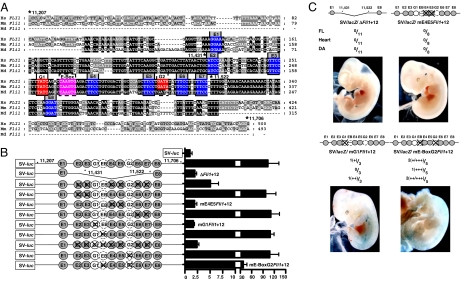
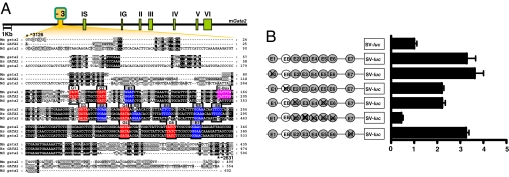
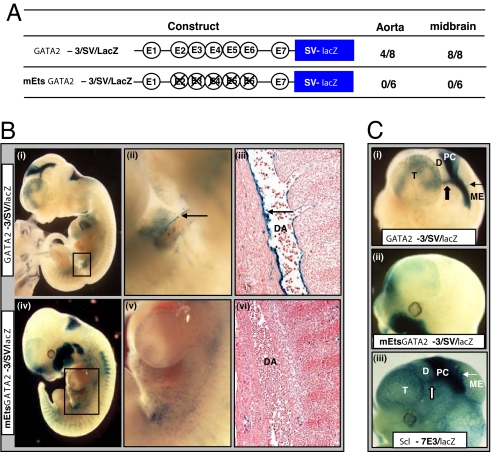
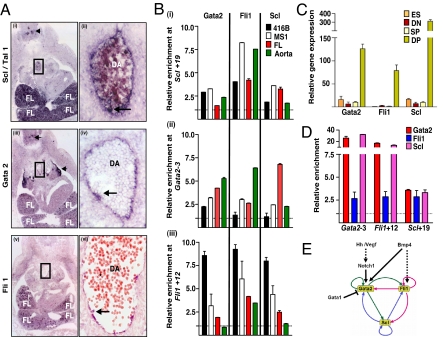
Conservation of the vertebrate body plan has been attributed to the evolutionary stability of gene-regulatory networks (GRNs). We describe a regulatory circuit made up of Gata2, Fli1, and Scl/Tal1 and their enhancers, Gata2-3, Fli1+12, and Scl+19, that operates during specification of hematopoiesis in the mouse embryo. We show that the Fli1+12 enhancer, like the Gata2-3 and Scl+19 enhancers, targets hematopoietic stem cells (HSCs) and relies on a combination of Ets, Gata, and E-Box motifs. We show that the Gata2-3 enhancer also uses a similar cluster of motifs and that Gata2, Fli1, and Scl are expressed in embryonic day-11.5 dorsal aorta where HSCs originate and in fetal liver where they multiply. The three HSC enhancers in these tissues and in ES cell-derived hemangioblast equivalents are bound by each of these transcription factors (TFs) and form a fully connected triad that constitutes a previously undescribed example of both this network motif in mammalian development and a GRN kernel operating during the specification of a mammalian stem cell.


Conflict of interest statement

The authors declare no conflict of interest.

Figures

Fig. 1.
Fig. 1.
The FLI1+12 hematopoietic enhancer targets blood stem cells. (A) The FLI1+12 enhancer directs reporter activity to blood and blood vessels. (i) Schematic diagram of the human FLI1 locus. A fragment of DNA corresponding to the FLI1+12 region was used to generate transgenic mice. (ii–vii) E7.5–E12.5 X-Gal-stained whole-mount WT and L5760 SV/lacZ/FLI1+12 embryos. (ii) E7.5 WT embryo with no staining. (iii) E7.5 transgenic embryo showing staining within the extra-embryonic hematopoietic region. (iv) E9.5 transgenic embryo showing staining of the heart chambers (boxed) and vitelline vessels (arrow). (v) E11.5 transgenic embryo showing staining within the FL (arrow) and blood vessels. (vi) E12.5 transgenic embryo showing staining in the vitelline vessels (arrow). (vii) Magnified view of the boxed area in vi showing FL staining (arrow). (viii–xiii) Paraffin sections of a E11.5 SV/lacZ/FLI1+12 embryo. (viii) Sagittal section of the DA showing staining in the endothelium. (ix) High-power view of the DA showing staining in a hematopoietic cluster (arrow). (x) Section through the FL showing staining in hematopoietic cells. (xi) High-power view of x. (xii) Section through the yolk sac showing staining in the wall of a blood vessel. (xiii) Section through the heart showing endocardial staining. (B) Flow cytometry of FDG treated nontransgenic and transgenic E12.5 FLs from a litter of SV/lacZ/FLI1+12 (L5760) × WT crosses. CD150+/CD48/CD41 cells are enriched in the population targeted by the transgene. YS, yolk sac.
Fig. 2.
Fig. 2.
Conserved Ets and Gata TF binding sites in the FLI1+12 enhancer are required for its activity in hematopoietic cells. (A) Nucleotide sequence alignment of the FLI1 +12 enhancer with conserved Gata, Ets, and E-box sites marked in red, blue, and pink, respectively. Nucleotide numbering is from the translation start site. mm, mouse; hs, human; md, opossum. (B) (Left) Reporter constructs of human WT and mutated genomic fragments corresponding to the FLI1+12 enhancer. The conserved Ets, Gata, and E-box sites are represented as circles (dashed margins for partial conservation), numbered E1–8, G1–2, and EB, respectively; they are crossed out where mutated. (Right) Results of stable transfection assays in 416B cells corresponding to each construct. The luciferase activities are given as fold-increase over the activity of the pGL2-promoter vector (SV-luc) alone. (C) Summary of F0 transgenic embryos generated with various SV/lacZ/mutant FLI1+12 constructs. Representative X-Gal-stained whole-mount E11.5 embryos are also shown. (+) to (++++) indicates from week/rare to strong X-Gal staining.
Fig. 3.
Fig. 3.
Conserved Ets TF binding sites in the Gata2-3 enhancer are required for its activity in hematopoietic cells. (A) Schematic diagram of the mouse Gata2 locus and nucleotide sequence alignment with conserved Gata, Ets, and E-box sites marked in red, blue, and pink respectively. The −3,126/−2,631 mGata2-3 region includes the 5H region (−3,097/−2,762) of the 3.1-kb Gata2-EHRD (9). Nucleotide numbering is from the mouse IS exon. mm, mouse; hs, human; md, opossum. (B) (Left) Reporter constructs of human WT and mutated Gata2-3 genomic fragments. The conserved Ets sites and E-box are represented as circles numbered E1–E7 and EB respectively; they are crossed out where mutated. (Right) Results of stable transfection assays in 416B cells corresponding to each construct. The luciferase activities are given as the fold-increase over the activity of the pGL2-promoter vector (SV-luc) alone.
Fig. 4.
Fig. 4.
The Gata2-3 enhancer targets the hemogenic aortic endothelium and requires Ets sites for its in vivo activity. (A) Transgenic lacZ reporter constructs with WT enhancer (Gata2-3) or enhancer with mutant Ets sites (mEts Gata2-3). The number of embryos showing staining in the DA (AGM region) or midbrain out of the total number of E10.5 and E11.5 F0 transgenic embryos generated with each construct is listed alongside. (B) Representative F0 embryos stained with X-Gal for lacZ expression. (i) Gata2-3/SV/lacZ E10.5 whole-mount showing staining in the DA (boxed). (ii) Magnified view of the boxed area in i showing concentration of the reporter along the ventral surface of the DA (arrow). (iii) Histological section corresponding to region in (ii) showing prominent endothelial staining (arrow). (iv) mEts Gata2-3/SV/lacZ E11.5 whole-mount embryo showing nonspecific staining in the region of the DA (boxed). (v) A magnified view of the boxed area in iv. (vi) Section corresponding to region in v showing absence of endothelial staining. (C) Magnified lateral view of heads of X-Gal stained F0 embryos in B. (i) Gata2-3/SV/lacZ whole-mount embryo showing prominent lacZ expression in the posterior commissure (block arrow) and tectal neurons into the mesencephalon (arrow). (ii) mEts Gata2-3/SV/lacZ whole-mount embryo showing loss of lacZ staining. The ectopic staining in the maxillary region was seen in only one of six F0 mutant transgenic embryos. (iii) Scl-7E3/lacZ wholemount embryo showing staining similar to that seen with the Gata2-3/SV/lacZ transgenics. D, diencephalon; ME, mesencephalon; PC, posterior commissure; T, telencephalon.
Fig. 5.
Fig. 5.
Gata2, Fli1 and Scl bind Gata2-3, Fli1+12 and Scl+19 in vivo. (A) (i and ii) In situ hybridization for Scl expression. (i) Transverse cryosection through a E11.5 embryo at the level of the AGM showing expression in FL, DA (boxed) and neural tissue (arrow). (ii) Magnified view of the boxed area showing expression in the endothelium and in a blood cluster (arrow). (iii and iv) In situ hybridization for Gata2 expression. (iii) Transverse cryosection through the AGM region of a E11.5 embryo showing Gata2 expression in the FL and DA (boxed). Prominent Gata2 expression is also seen in neural tissue (arrows). (iv) Magnified view of the boxed area in iii showing Gata2 expression in the endothelium and in a blood cluster (arrow). (v and vi) In situ hybridization for Fli1 expression. (v) Transverse cryosection through the AGM region of a E11.5 embryo showing Fli1 expression in the FL. (vi) Transverse paraffin section through the AGM region showing expression in the endothelium and blood clusters (arrow). (B) (i–iii) ChIP assays of blood progenitor (416B) and endothelial (MS1) cell lines and primary hematopoietic tissues (abdominal aorta and FL) from E11.5 embryos. Levels of enrichment were normalized to that obtained with a control rabbit antibody and are plotted as a fold-increase over that measured at a control region (Scl+21). (C) Variation in Gata2, Fli1, and Scl gene expression during in vitro differentiation of GFP-Bry ES cells to EBs. (D) Quantitative ChIP assay on in vitro differentiated, unsorted GFP-Bry EBs, of which ≈49% of cells were GFP+Flk1+ (DP) at day 3 (SI Fig 7). (E) A fully connected triad of haematopoietic TFs. The Gata2/Fli1/Scl triad with putative initiators. Direct binding interactions are represented by solid lines.

Similar articles

Cited by

References

    1. Weissman IL. Cell. 2000;100:157–168. - PubMed
    1. Enver T, Greaves M. Cell. 1998;94:9–12. - PubMed
    1. Porcher C, Swat W, Rockwell K, Fujiwara Y, Alt FW, Orkin SH. Cell. 1996;86:47–57. - PubMed
    1. Robb L, Elwood NJ, Elefanty AG, Kontgen F, Li R, Barnett LD, Begley CG. EMBO J. 1996;15:4123–4129. - PMC - PubMed
    1. Tsai FY, Keller G, Kuo FC, Weiss M, Chen J, Rosenblatt M, Alt FW, Orkin SH. Nature. 1994;371:221–226. - PubMed

Publication types

MeSH terms

Substances