

doi: 10.1073/pnas.0704916104.
Epub 2007 Oct 25.
Novelty and collective attention
Affiliations
- PMID: 17962416
- PMCID: PMC2077036
- DOI: 10.1073/pnas.0704916104
Item in Clipboard
Novelty and collective attention
Proc Natl Acad Sci U S A.
.
Abstract
The subject of collective attention is central to an information age where millions of people are inundated with daily messages. It is thus of interest to understand how attention to novel items propagates and eventually fades among large populations. We have analyzed the dynamics of collective attention among 1 million users of an interactive web site, digg.com, devoted to thousands of novel news stories. The observations can be described by a dynamical model characterized by a single novelty factor. Our measurements indicate that novelty within groups decays with a stretched-exponential law, suggesting the existence of a natural time scale over which attention fades.
Conflict of interest statement
The authors declare no conflict of interest.
Figures
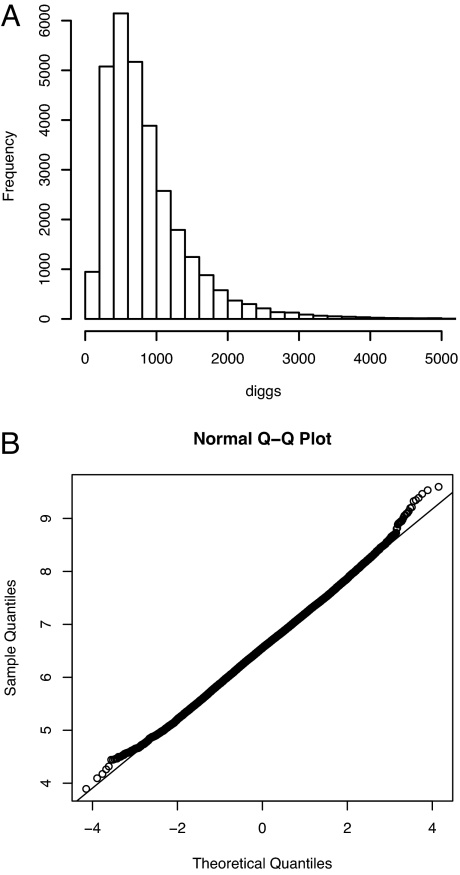
Frequency and distribution of diggs. (A) The histogram of the 29,684 diggs in 2006, as of January 9, 2007. (B) The normal Q–Q plot of log(N∞). The straight line shows that log(N∞) follows a normal distribution with a slightly longer tail. This is due to digg.com's built-in reinforcement mechanism that favors those “top stories” that can stay on the front page and can be found at many other places (e.g., “popular stories in 30 days” and “popular stories in 365 days”).
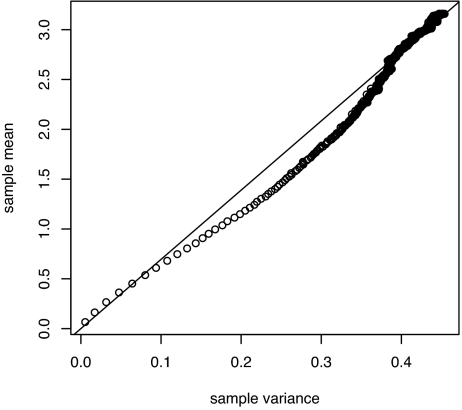
Sample mean of log Nt − log N0 versus sample variance, for 1,110 stories in January 2007. Time unit is 1 minute. The points are plotted as follows. For each story, we calculate the quantity log Nt − log N0, which is the logarithm of its digg number measured t minutes after its first appearance on the front page, minus the logarithm of its initial digg number. We collect 1,110 such quantities for 1,110 stories. Then we compute their sample mean y and sample variance x, and mark the point (x,y). This is for one t. We repeat the process for t = 1,2,…, 1,440 and plot 1,440 points in total (i.e., 24 h). They lie roughly on a straight line passing through the origin with slope 6.9.
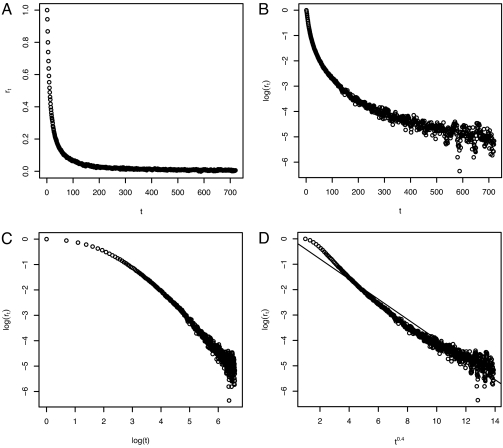
Decay factor curves. (A) The decay factor rt as a function of time. Time t is measured in minutes. (B) Log(rt) versus t. rt decays slower than exponential. (C) Log(rt) versus t. rt decays faster than power law. (D) Log(rt) versus t0.4. The slope is ≈−0.4.
References
-
- Kahneman D. Attention and Effort. Englewood Cliffs, NJ: Prentice Hall; 1973.
-
- Pashler HE. The Psychology of Attention. Cambridge, MA: MIT Press; 1998.
-
- Pieters FGM, Rosbergen E, Wedel M. J Marketing Res. 1999;36:424–438.
-
- Dukas R. Brain Behav Evol. 2004;63:197–210. - PubMed
-
- Reis RI. J Monetary Econ. 2006;53:1761–1800.
MeSH terms
LinkOut - more resources
Full Text Sources
Other Literature Sources
