. 2008 Jan;26(1):266-78.
doi: 10.1634/stemcells.2007-0436. Epub 2007 Oct 25.

Gdnf upregulates c-Fos transcription via the Ras/Erk1/2 pathway to promote mouse spermatogonial stem cell proliferation

Affiliations

Gdnf upregulates c-Fos transcription via the Ras/Erk1/2 pathway to promote mouse spermatogonial stem cell proliferation

Zuping He et al. Stem Cells. 2008 Jan.

Abstract

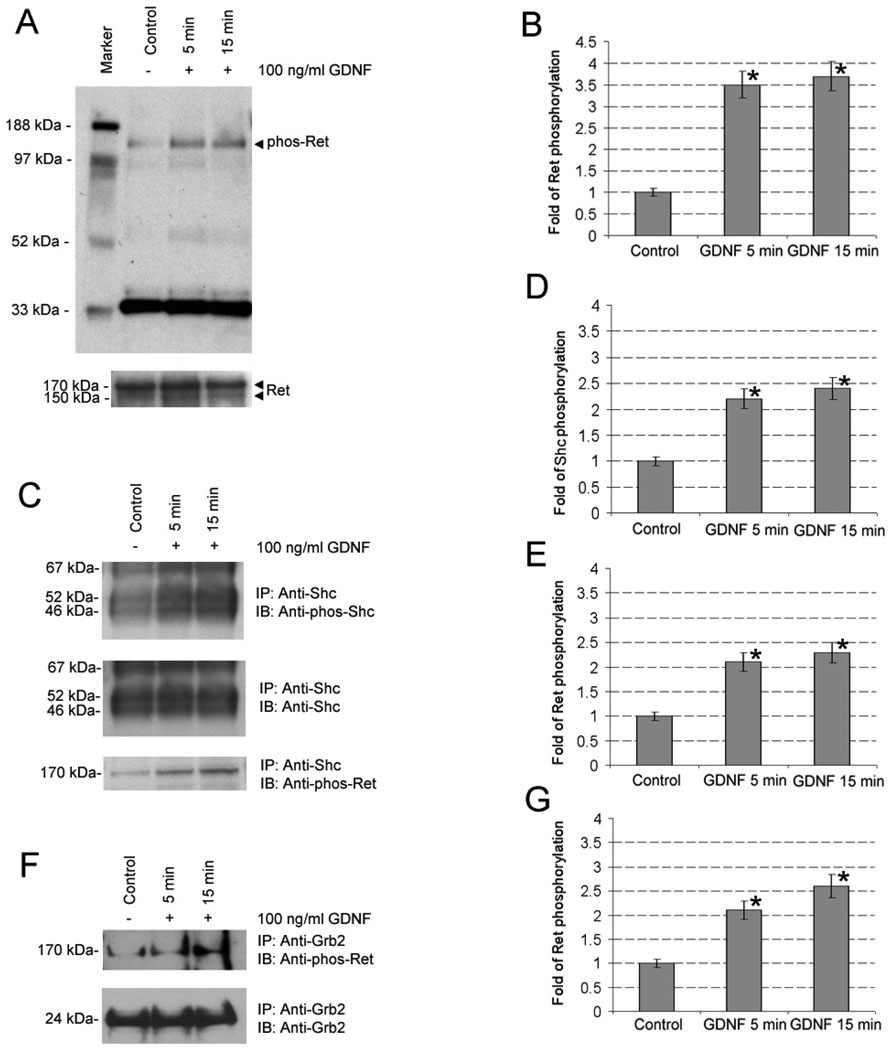
Glial cell line-derived neurotrophic factor (GDNF) plays a crucial role in regulating the proliferation of spermatogonial stem cells (SSC). The signaling pathways mediating the function of GDNF in SSC remain unclear. This study was designed to determine whether GDNF signals via the Ras/ERK1/2 pathway in the C18-4 cells, a mouse SSC line. The identity of this cell line was confirmed by the expression of various markers for germ cells, proliferating spermatogonia, and SSC, including GCNA1, Vasa, Dazl, PCNA, Oct-4, GFRalpha1, Ret, and Plzf. Western blot analysis revealed that GDNF activated Ret tyrosine phosphorylation. All 3 isoforms of Shc were phosphorylated upon GDNF stimulation, and GDNF induced the binding of the phosphorylated Ret to Shc and Grb2 as indicated by immunoprecipitation and Western blotting. The active Ras was induced by GDNF, which further activated ERK1/2 phosphorylation. GDNF stimulated the phosphorylation of CREB-1, ATF-1, and CREM-1, and c-fos transcription. Notably, the increase in ERK1/2 phosphorylation, c-fos transcription, bromodeoxyuridine incorporation, and metaphase counts induced by GDNF, was completely blocked by pretreatment with PD98059, a specific inhibitor for MEK1, the upstream regulator of ERK1/2. GDNF stimulation eventually upregulated cyclin A and CDK2 expression. Together, these data suggest that GDNF induces CREB/ATF-1 family member phosphorylation and c-fos transcription via the Ras/ERK1/2 pathway to promote the proliferation of SSC. Unveiling GDNF signaling cascades in SSC has important implications in providing attractive targets for male contraception as well as for the regulation of stem cell renewal vs. differentiation.


Conflict of interest statement

DISCLOSURES: The authors indicate no potential conflicts of interest.

Figures

Figure 1
Figure 1
The expression of GCNA1, PCNA, Oct-4, GFRα1, and Ret in the C18-4 cells as shown by RT-RCR and immunocytochemistry. (A) RT-PCR analysis shows the mRNA of PCNA, Oct-4, GFRα1, and Ret in the C18-4 cells. All the RNA samples were treated with DNase to remove the potential contamination of genomic DNA before RT, and the RNA sample without RT but with PCR was used as a negative control. (B–F) Immunocytochemical staining shows the protein expression of GCNA1 (red fluorescence, nuclei) (B), PCNA (green fluorescence, nuclei) (C), Oct-4 (green fluorescence, nuclei) (D), GFRα1 (green fluorescence, surface cytoplasm and plasma membrane) (E), Ret (green fluorescence, cytoplasm) (F), in the C18-4 cells. Staining with DAPI (blue fluorescence) was used to identify cell nuclei. Scale bars in B, C, D, E, and F =10 µm.
Figure 2
Figure 2
The teyrosine phosphorylation of Ret and Shc is activated by GDNF stimulation in the C18-4 cells and both Shc and Grb2 are co-immunoprecipitated with the phosphorylated Ret in the C18-4 cells after GDNF stimulation. (A) The C18-4 cells were serum-starved for 16 h and then treated with 100 ng/ml GDNF for 5 and 15 min or without GDNF treatment. Fifty micrograms of total protein from the GDNF treated or untreated cells were resolved by 4–12% SDS-PAGE and blotted with anti-phospho-Ret (upper panel). The same membrane was re-probed with anti-Ret and showed Ret protein expression in all lanes (lower panel). The molecular mass standards are shown on the left, and the results are representative of three independent experiments. (B) The GDNF-induced phosphorylation of Ret relative to control (1.0) after normalization to the signal obtained with Ret. Satistically significant differences (p< 0.05) between the GDNF-treated and -untreated group were indicated by asterisks. (C) Five hundred micrograms of total protein from the GDNF treated or untreated cells were immunoprecipitated with anti-Shc, and half the immunoprecipitates was blotted with anti-phosphor-Shc (upper panel). The same membrane was re-probed with anti-Shc and showed Shc expression in all lanes (middle panel). The same membranes were re-probed with anti-phospho-Ret and they displayed the tyrosine phosphorylation of Ret that were pulled down together with Shc during the immunoprecipitation (lower panel). IP: immunoprecipitation; IB: immunoblotting. The molecular weights are shown on the left, and the results are representative of three independent experiments. (D–E) The GDNF-induced phosphorylation of Shc (52 kDa) and phospho-Ret relative to control (1.0) after normalization to the signal obtained with Shc (52 kDa). Satistically significant differences (p< 0.05) between the GDNF-treated and -untreated group were indicated by asterisks. (F) Three hundred micrograms of total protein from the GDNF treated or untreated cells were immunoprecipitated with anti-Grb2, and half the immunoprecipitates was blotted with anti-phosphor-Ret, showing the tyrosine phosphorylation of Ret that was pulled down together with Grb2 during the immunoprecipitation in the C18-4 cells (upper panel). The same membrane was re-probed with anti-Grb2 and showed Grb2 expression in all lanes (lower panel). IP: immunoprecipitation; IB: immunoblotting. The molecular weights are shown on the left, and the results are representative of three independent experiments. (G) The GDNF-induced phosphorylation of Ret relative to control (1.0) after normalization to the signal obtained with Grb2. Satistically significant differences (p< 0.05) between the GDNF-treated and -untreated group were indicated by asterisks.
Figure 3
Figure 3
The Ras/ERK1/2 pathway is activated by GDNF in the C18-4 cells and type A spermatogonia. (A) Pull-down assay of the activated GTP-loaded Ras with a GST-fusion protein containing the RBD of Raf1 to affinity precipitate active Ras (GTP-Ras) from cell lysates of the C18-4 cells. Five hundred micrograms of cell lysates from the GDNF treated or untreated cells were incubated with GST-Raf1-RBD and an Immobilized Glutathione Disc, and half the pulled-down active Ras was detected by Western blotting using antibody to Ras. IP: immunoprecipitation; IB: immunoblotting. The molecular mass standards are shown on the left, and the results are representative of three independent experiments. (B) The GDNF-induced active Ras relative to the GDNF-untreated control (1.0). Satistically significant differences (p< 0.05) between the GDNF-treated and -untreated group were indicated by asterisks. (C) The C18-4 cells were serum-starved for 16 h and then pretreated with or without PD98059 for 30 min. The cells were treated with 100 ng/ml GDNF for 5 and 15 min or without GDNF treatment. Fifty micrograms of total protein from the GDNF treated or untreated cells were resolved by SDS-PAGE and blotted with anti-phospho-ERK1/2 (upper panel). The same membrane was re-probed with anti-ERK2 and showed ERK2 expression in all lanes (lower panel). The molecular mass standards are shown on the left, and the results are representative of three independent experiments. (D) The GDNF-induced phosphorylation of ERK2 (42 kDa) relative to control (1.0) after normalization to the signal obtained with ERK2. Satistically significant differences (p< 0.05) between the GDNF-treated and -untreated group were indicated by asterisks. (E) Pull-down assay of the activated GTP-loaded Ras with a GST-fusion protein containing the RBD to affinity precipitate active Ras from cell lysates of the freshly isolated type A spermatogonia. Three hundred micrograms of cell lysates from the GDNF treated or untreated cells were incubated with GST-Raf1-RBD and an Immobilized Glutathione Disc, and half the pulled-down active Ras was detected by Western blotting using an antibody to Ras. IP: immunoprecipitation; IB: immunoblotting. The molecular weight is shown on the left, and the results are representative of two experiments. (F) The GDNF-induced active Ras relative to the GDNF-untreated control (1.0). Satistically significant differences (p< 0.05) between the GDNF-treated and -untreated group were indicated by asterisks. (G) Type A spermatogonia of 6-day-old mice were serum-starved for 8 h and then treated with 100 ng/ml GDNF for 5 and 15 min or without GDNF treatment. Eighty micrograms of total protein from the GDNF treated or untreated cells were resolved by SDS-PAGE and blotted with anti-phospho-ERK1/2 (upper panel). The same membrane was re-probed with anti-ERK2 and showed ERK2 expression in all lanes (lower panel). The molecular weights are shown on the left, and the results are representative of two experiments. (H) The GDNF-induced phosphorylation of ERK2 (42 kDa) relative to control (1.0) after normalization to the signal obtained with ERK2. Satistically significant differences (p< 0.05) between the GDNF-treated and -untreated group were indicated by asterisks.
Figure 4
Figure 4
The phosphorylation of CREB-1, ATF-1, and CREM-1 and c-fos transcription are induced by GDNF in the C18-4 cells and the up-regulation of c-fos transcription by GDNF is blocked by the inhibitor PD98059. (A) The phosphorylation of CREB-1 at Ser-133 and the CREB-related protein ATF-1 and CREM-1 are activated by GDNF in the C18-4 cells as shown by Western blots of 50 µg of total cell lysates with a specific anti-phospho-CREB1 antibody (upper panel). The same membrane was re-probed with anti-β-actin and demonstrated β-actin expression in all lanes (lower panel). The molecular weights are shown on the left, and the results are representative of three independent experiments. (B–D) The GDNF-induced phosphorylation of CREB-1 (B), ATF-1 (C), and CREM-1 (D) relative to control (1.0) after normalization to the signal of β-actin. Satistically significant differences (p< 0.05) between the GDNF-treated and -untreated group were indicated by asterisks. (E) RT-PCR analysis shows the time course of increase in c-fos mRNA induced by GDNF in C18-4 cells. The results are representative of three independent experiments. (F) The GDNF-induced c-fos mRNA relative to control (1.0) after normalization to the signal of Gapdh. Satistically significant differences (p< 0.05) between the GDNF-treated and -untreated group were indicated by asterisks. (G) RT-PCR analysis displays the c-fos mRNA in C18-4 cells pretreated with PD98059 for 30 min and then with GDNF treatment for 5 min and 15 min or without GDNF treatment. The results are representative of three independent experiments. (H) The GDNF-induced c-fos mRNA relative to control (1.0) after normalization to the signal of Gapdh. Satistically significant differences (p< 0.05) between the GDNF-treated and -untreated group were indicated by asterisks.
Figure 5
Figure 5
Inhibitor PD98059 blocks GDNF-induced BrdU incorporation in the C18-4 cells. The C18-4 cells were pretreated with or without PD98059 for 30 min, and then GDNF was added to the culture medium as described in the Materials and Methods. After 16 h of culture, the cells were fixed, immunostained with anti-BrdU antibody, followed by incubation with the biotinylated second antibody and streptavidin-peroxidase, and detected by DAB chromogen. Immunocytochemical staining shows the BrdU incorporation in the C18-4 cells without GDNF treatment (A), the cells with GDNF treatment (B), and in the cells pretreated with PD98059 and then with GDNF treatment (C), using anti-BrdU. The BrdU-positive cells are indicated by the arrows, and BrdU negative cells are denoted by asterisks. Scale bars in A, B, and C =10 µm. (D) Percentage of the BrdU-positive cells in the C18-4 cells without or with GDNF treatment, or in the cells pretreated with PD98059 and then with GDNF stimulation. The data were presented as mean ± SEM of BrdU-positive cells out of 500 cells. The percentage of BrdU-positive cells is significantly increased (p <0.05, as indicated by asterisk) in GDNF-treated cells compared to the untreated cells or the cells pretreatment with PD98059.
Figure 6
Figure 6
Inhibitor PD98059 blocks GDNF-induced metaphase counts in the C18-4 cells and the expression of cell cycle regulators, including cyclin A, cyclin D1, and CDK2 in the C18-4 cells with or without GDNF treatment. The C18-4 cells were cultured in the absence or constant presence of GDNF and/or PD98059 for 24 h. The cells were stained with Giemsa solution, showing morphological characteristics in the C18-4 cells without GDNF treatment (A), the cells with GDNF treatment (B), and in the cells pretreated with PD98059 and then with GDNF treatment (C). The asterisks indicate the condensed metaphase chromosomes typical of mitotic nuclei. Scale bars in A, B, and C =10 µm. (D) Percentage of the cells in metaphse in the C18-4 cells without or with GDNF treatment, or in the cells pretreated with PD98059 and then with GDNF stimulation. The percentage of the cells in metaphase was statistically increased (p <0.05, as indicated by asterisk) in GDNF-treated cells compared to the GDNF-untreated cells or the cells pretreated with PD98059. (E) Western blot analysis reveals an increase in the expression of cyclin A and CDK2 but not cyclin D1 in the C18-4 cells stimulated with GDNF for 6 and 24 h. Inhibitor PD98059 blocked GDNF-induced cyclin A and CDK2 expression in these cells. The membranes were re-probed with anti-β-actin and showed β-actin expression in all lanes. The molecular weights are shown on the left, and the results are representative of three independent experiments. (F) Immunofluorescence analysis shows that an accumulation of cyclin A expression was induced by GDNF treatment for 6 and 24 h in the nuclei of the C18-4 cells when compared to the cells without GDNF stimulation. Staining with DAPI (blue fluorescence) was used to show the cell nuclei. Scale bars =10 µm. (G–H) The GDNF-induced expression of cyclin A (G) and CDK2 (H) relative to control (1.0) after normalization to the signal of β-actin. Satistically significant differences (p< 0.05) between the GDNF-treated and -untreated group were indicated by asterisks.
Figure 7
Figure 7
The schematic diagram demonstrates intracellular signaling events in the Ras/ERK1/2 pathway as well as the upstream and downstream cascades activated by GDNF in the C18-4 cells. “P” indicates “phosphorylate”, and “A” denotes “activate”.

Similar articles

Cited by

References

    1. de Rooij DG, Russell LD. All you wanted to know about spermatogonia but were afraid to ask. J Androl. 2000;21:776–798. - PubMed
    1. Brinster RL. Germline stem cell transplantation and transgenesis. Science. 2002;296:2174–2176. - PMC - PubMed
    1. Dym M. Spermatogonial stem cells of the testis. Proc Natl Acad Sci U S A. 1994;91:11287–11289. - PMC - PubMed
    1. Meng X, Lindahl M, Hyvonen ME, et al. Regulation of cell fate decision of undifferentiated spermatogonia by GDNF. Science. 2000;287:1489–1493. - PubMed
    1. Sariola H, Saarma M. Novel functions and signalling pathways for GDNF. J Cell Sci. 2003;116:3855–3862. - PubMed

Publication types

MeSH terms

Substances