

Assessment of rat and mouse RGC apoptosis imaging in vivo with different scanning laser ophthalmoscopes
- PMID: 17963105
- PMCID: PMC2601026
- DOI: 10.1080/02713680701585872
Assessment of rat and mouse RGC apoptosis imaging in vivo with different scanning laser ophthalmoscopes
Abstract
Purpose: We have recently described a novel way of imaging apoptosing retinal ganglion cells in vivo in the rat. This study investigated if this technique could be used in the mouse, and whether the Heidelberg Retina Angiograph II (HRAII) was appropriate.
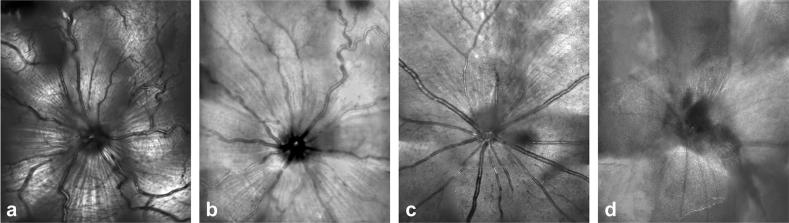
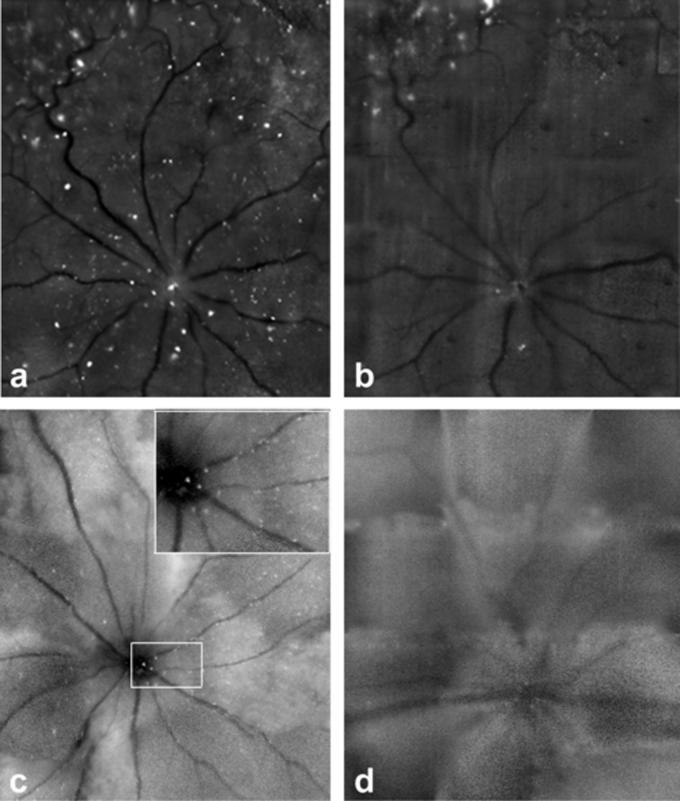
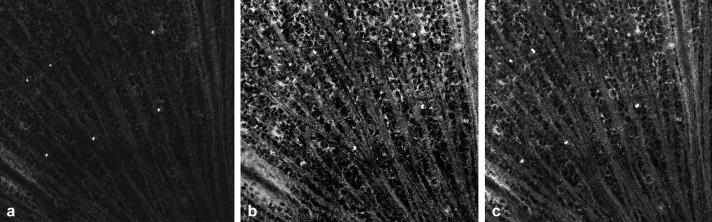
Methods: Retinal ganglion cell (RGC) death was induced by intravitreal injections in rat and mouse eyes using staurosporine. Fluorescent-labeled apoptosing cells were detected by imaging with both the HRAII and a prototype Zeiss confocal scanning laser ophthalmoscope (cSLO). Averaged in vivo images were analyzed and results compared with histologic analysis.
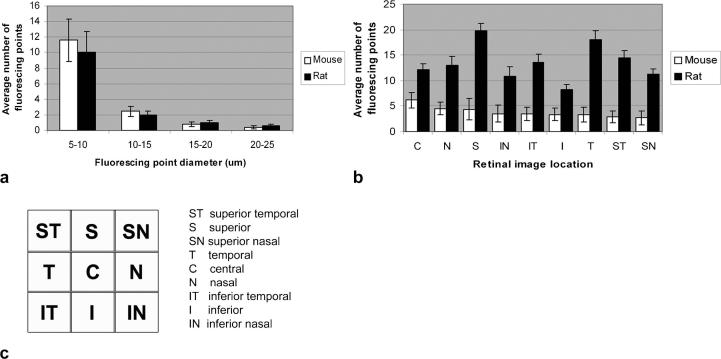
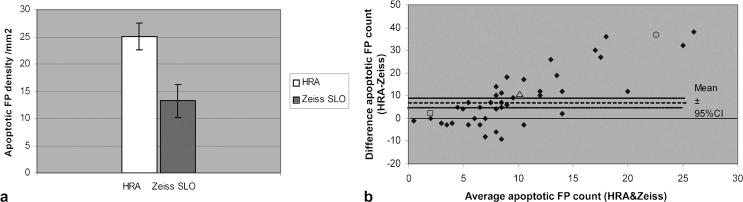
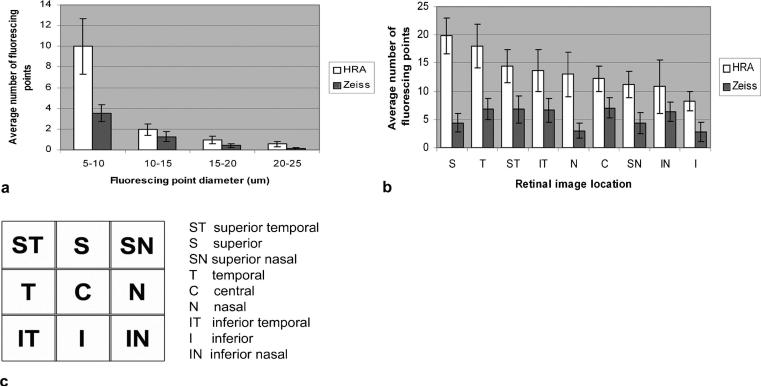
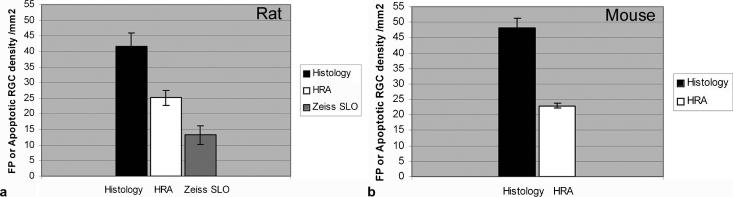
Results: Fluorescent points (FPs) used as a measure of RGC apoptosis in vivo were detected in the mouse eye but only with the HRAII and not the Zeiss cSLO. The HRAII was able to detect 62% more FPs in rat than the Zeiss cSLO. Both cSLOs showed peak FP counts at the 5- to 10-microm range in rat and mouse. Maximal FP counts were detected in the superior and superior temporal regions in the rat, with no obvious pattern of distribution in the mouse. The HRAII was found to have more FP correspondence with histologically identified apoptosing RGCs.
Conclusions: To our knowledge, this is the first demonstration of visualized apoptosing RGC in vivo in a mouse. The improved image quality achieved with the HRAII compared with the Zeiss cSLO was validated by histology. This together with its enhanced maneuverability and the fact that it is already commercially available make the HRAII a potential tool for the early detection and diagnosis of glaucomatous disease in patients.
Figures
Similar articles
-
Fundus autofluorescence imaging compared with different confocal scanning laser ophthalmoscopes.Br J Ophthalmol. 2003 Nov;87(11):1381-6. doi: 10.1136/bjo.87.11.1381. Br J Ophthalmol. 2003. PMID: 14609839 Free PMC article.
-
In vivo imaging and counting of rat retinal ganglion cells using a scanning laser ophthalmoscope.Invest Ophthalmol Vis Sci. 2006 Jul;47(7):2943-50. doi: 10.1167/iovs.05-0708. Invest Ophthalmol Vis Sci. 2006. PMID: 16799037
-
Single-cell resolution imaging of retinal ganglion cell apoptosis in vivo using a cell-penetrating caspase-activatable peptide probe.PLoS One. 2014 Feb 21;9(2):e88855. doi: 10.1371/journal.pone.0088855. eCollection 2014. PLoS One. 2014. PMID: 24586415 Free PMC article.
-
Real-Time Imaging of Retinal Cell Apoptosis by Confocal Scanning Laser Ophthalmoscopy and Its Role in Glaucoma.Front Neurol. 2018 May 15;9:338. doi: 10.3389/fneur.2018.00338. eCollection 2018. Front Neurol. 2018. PMID: 29867744 Free PMC article. Review.
-
The scanning laser ophthalmoscope--a review of its role in bioscience and medicine.Phys Med Biol. 2004 Apr 7;49(7):1085-96. doi: 10.1088/0031-9155/49/7/001. Phys Med Biol. 2004. PMID: 15128191 Review.
Cited by
-
Assessment of neuroprotection in the retina with DARC.Prog Brain Res. 2008;173:437-50. doi: 10.1016/S0079-6123(08)01130-8. Prog Brain Res. 2008. PMID: 18929126 Free PMC article. Review.
-
High-resolution ocular imaging: combining advanced optics and microtechnology.Ophthalmic Surg Lasers Imaging. 2009 Sep-Oct;40(5):480-8. doi: 10.3928/15428877-20090901-07. Ophthalmic Surg Lasers Imaging. 2009. PMID: 19772272 Free PMC article. Review.
-
[In vivo imaging of retinal cell apoptosis following acute light exposure].Ophthalmologe. 2010 Jan;107(1):22-9. doi: 10.1007/s00347-009-1952-y. Ophthalmologe. 2010. PMID: 19499229 German.
-
Imaging multiple phases of neurodegeneration: a novel approach to assessing cell death in vivo.Cell Death Dis. 2010;1(1):e3. doi: 10.1038/cddis.2009.3. Cell Death Dis. 2010. PMID: 21364622 Free PMC article.
-
Topical Coenzyme Q10 demonstrates mitochondrial-mediated neuroprotection in a rodent model of ocular hypertension.Mitochondrion. 2017 Sep;36:114-123. doi: 10.1016/j.mito.2017.05.010. Epub 2017 May 24. Mitochondrion. 2017. PMID: 28549843 Free PMC article.
References
-
- Vila M, Przedborski S. Targeting programmed cell death in neurodegenerative diseases. Nat Rev Neurosci. 2003;4(5):365–375. - PubMed
-
- Raina AK, Hochman A, Ickes H, et al. Apoptotic promoters and inhibitors in Alzheimer's disease: who wins out? Prog Neuropsychopharmacol Biol Psychiatry. 2003;27(2):251–254. - PubMed
-
- Friedlander RM. Apoptosis and caspases in neurodegenerative diseases. N Engl J Med. 2003;348(14):1365–1375. - PubMed
-
- Quigley HA, Nickells RW, Kerrigan LA, et al. Retinal ganglion cell death in experimental glaucoma and after axotomy occurs by apoptosis. Invest Ophthalmol Vis Sci. 1995;36(5):774–786. - PubMed
Publication types
MeSH terms
Grants and funding
LinkOut - more resources
Full Text Sources
Other Literature Sources
Miscellaneous