Characteristics and pathological mechanism on magnetic resonance diffusion-weighted imaging after chemoembolization in rabbit liver VX-2 tumor model
- PMID: 17963295
- PMCID: PMC4171255
- DOI: 10.3748/wjg.v13.i43.5699
Characteristics and pathological mechanism on magnetic resonance diffusion-weighted imaging after chemoembolization in rabbit liver VX-2 tumor model
Abstract
Aim: To investigate dynamic characteristics and pathological mechanism of signal in rabbit VX-2 tumor model on diffusion-weighted imaging (DWI) after chemoembolization.
Methods: Forty New Zealand rabbits were included in the study and forty-seven rabbit VX-2 tumor models were raised by implanting directly and intrahepatically after abdominal cavity opened. Forty VX-2 tumor models from them were divided into four groups. DWI was performed periodically and respectively for each group after chemoembolization. All VX-2 tumor samples of each group were studied by pathology. The distinction of VX-2 tumors on DWI was assessed by their apparent diffusion coefficient (ADC) values. The statistical significance between different time groups, different area groups or different b-value groups was calculated by using SPSS12.0 software.
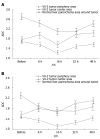
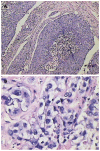
Results: Under b-value of 100 s/mm(2), ADC values were lowest at 16 h after chemoembolization in area of VX-2 tumor periphery, central, and normal liver parenchyma around tumor, but turned to increase with further elongation of chemoembolization treatment. The distinction of ADC between different time groups was significant respectively (F = 7.325, P < 0.001; F = 2.496, P < 0.048; F = 6.856, P < 0.001). Cellular edema in the area of VX-2 tumor periphery or normal liver parenchyma around tumor, increased quickly in sixteen h after chemoembolization but, from the 16th h to the 48th h, cellular edema in the area of normal liver parenchyma around tumor decreased gradually and that in the area of VX-2 tumor periphery decreased lightly at, and then increased continually. After chemoembolization, Cellular necrosis in the area of VX-2 tumor periphery was more significantly high than that before chemoembolization. The areas of dead cells in VX-2 tumors manifested low signal and high ADC value, while the areas of viable cells manifested high signal and low ADC value.
Conclusion: DWI is able to detect and differentiate tumor necrotic areas from viable cellular areas before and after chemoembolization. ADC of normal liver parenchyma and VX-2 tumor are influenced by intracellular edema, tissue cellular death and microcirculation disturbance after chemoembolization.
Figures


Similar articles
-
Dynamic characteristics of MR diffusion-weighted imaging in a rabbit liver VX-2 tumor model.Jpn J Radiol. 2013 Feb;31(2):105-14. doi: 10.1007/s11604-012-0156-6. Epub 2012 Dec 13. Jpn J Radiol. 2013. PMID: 23238965
-
Characteristics of liver on magnetic resonance diffusion-weighted imaging: dynamic and image pathological investigation in rabbit liver VX-2 tumor model.World J Gastroenterol. 2008 Jul 7;14(25):3997-4004. doi: 10.3748/wjg.14.3997. World J Gastroenterol. 2008. PMID: 18609683 Free PMC article.
-
Gene expression and MR diffusion-weighted imaging after chemoembolization in rabbit liver VX-2 tumor model.World J Gastroenterol. 2008 Sep 28;14(36):5557-63; discussion 5562. doi: 10.3748/wjg.14.5557. World J Gastroenterol. 2008. PMID: 18810775 Free PMC article.
-
MR diffusion-weighted imaging of rabbit liver VX-2 tumor.World J Gastroenterol. 2005 May 28;11(20):3070-4. doi: 10.3748/wjg.v11.i20.3070. World J Gastroenterol. 2005. PMID: 15918192 Free PMC article.
-
DWI/ADC in response assessment after local-regional treatment of HCC - Pearls and Pitfalls.Eur J Radiol. 2025 Jul;188:112156. doi: 10.1016/j.ejrad.2025.112156. Epub 2025 May 6. Eur J Radiol. 2025. PMID: 40347825 Review.
Cited by
-
Diffusion-weighted imaging of the liver: Current applications.World J Radiol. 2016 Nov 28;8(11):857-867. doi: 10.4329/wjr.v8.i11.857. World J Radiol. 2016. PMID: 27928467 Free PMC article. Review.
-
Diffusion-weighted magnetic resonance imaging to predict response of hepatocellular carcinoma to chemoembolization.World J Gastroenterol. 2010 Jul 7;16(25):3161-7. doi: 10.3748/wjg.v16.i25.3161. World J Gastroenterol. 2010. PMID: 20593501 Free PMC article.
-
Dynamic characteristics of MR diffusion-weighted imaging in a rabbit liver VX-2 tumor model.Jpn J Radiol. 2013 Feb;31(2):105-14. doi: 10.1007/s11604-012-0156-6. Epub 2012 Dec 13. Jpn J Radiol. 2013. PMID: 23238965
-
Survival prediction based on qualitative MRI diffusion signature in patients with recurrent high grade glioma treated with bevacizumab.Quant Imaging Med Surg. 2018 Apr;8(3):268-279. doi: 10.21037/qims.2018.04.05. Quant Imaging Med Surg. 2018. PMID: 29774180 Free PMC article.
References
-
- Morimoto M, Shirato K, Sugimori K, Kokawa A, Tomita N, Saito T, Imada T, Tanaka N, Nozawa A, Numata K, et al. Contrast-enhanced harmonic gray-scale sonographic-histologic correlation of the therapeutic effects of transcatheter arterial chemoembolization in patients with hepatocellular carcinoma. AJR Am J Roentgenol. 2003;181:65–69. - PubMed
-
- Kubota K, Hisa N, Nishikawa T, Fujiwara Y, Murata Y, Itoh S, Yoshida D, Yoshida S. Evaluation of hepatocellular carcinoma after treatment with transcatheter arterial chemoembolization: comparison of Lipiodol-CT, power Doppler sonography, and dynamic MRI. Abdom Imaging. 2001;26:184–190. - PubMed
-
- Ebied OM, Federle MP, Carr BI, Pealer KM, Li W, Amesur N, Zajko A. Evaluation of responses to chemoembolization in patients with unresectable hepatocellular carcinoma. Cancer. 2003;97:1042–1050. - PubMed
-
- Kim HC, Kim AY, Han JK, Chung JW, Lee JY, Park JH, Choi BI. Hepatic arterial and portal venous phase helical CT in patients treated with transcatheter arterial chemoembolization for hepatocellular carcinoma: added value of unenhanced images. Radiology. 2002;225:773–780. - PubMed
-
- Shankar S, vanSonnenberg E, Morrison PR, Tuncali K, Silverman SG. Combined radiofrequency and alcohol injection for percutaneous hepatic tumor ablation. AJR Am J Roentgenol. 2004;183:1425–1429. - PubMed
Publication types
MeSH terms
LinkOut - more resources
Full Text Sources
Medical

