

Hypertabastic survival model
- PMID: 17963492
- PMCID: PMC2169222
- DOI: 10.1186/1742-4682-4-40
Hypertabastic survival model
Abstract
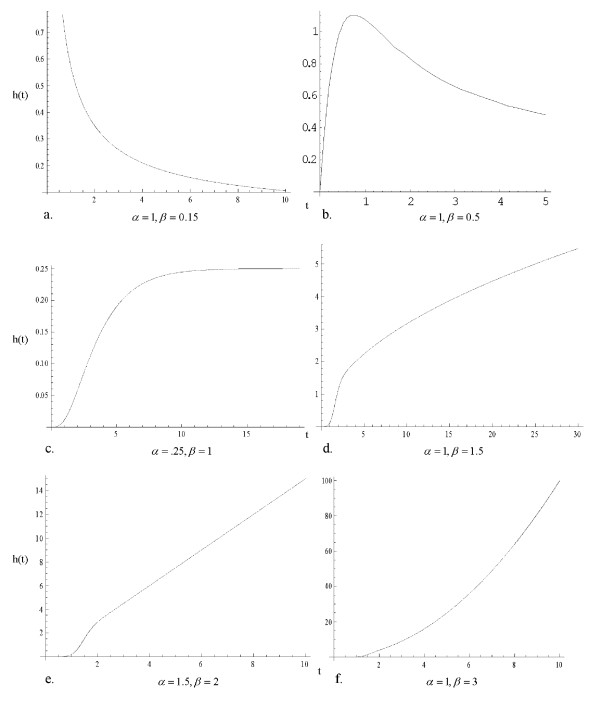
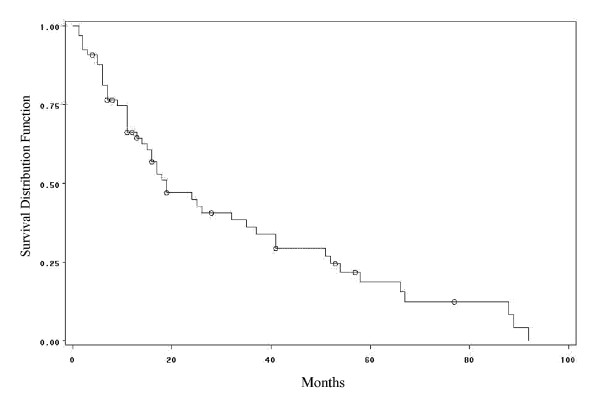
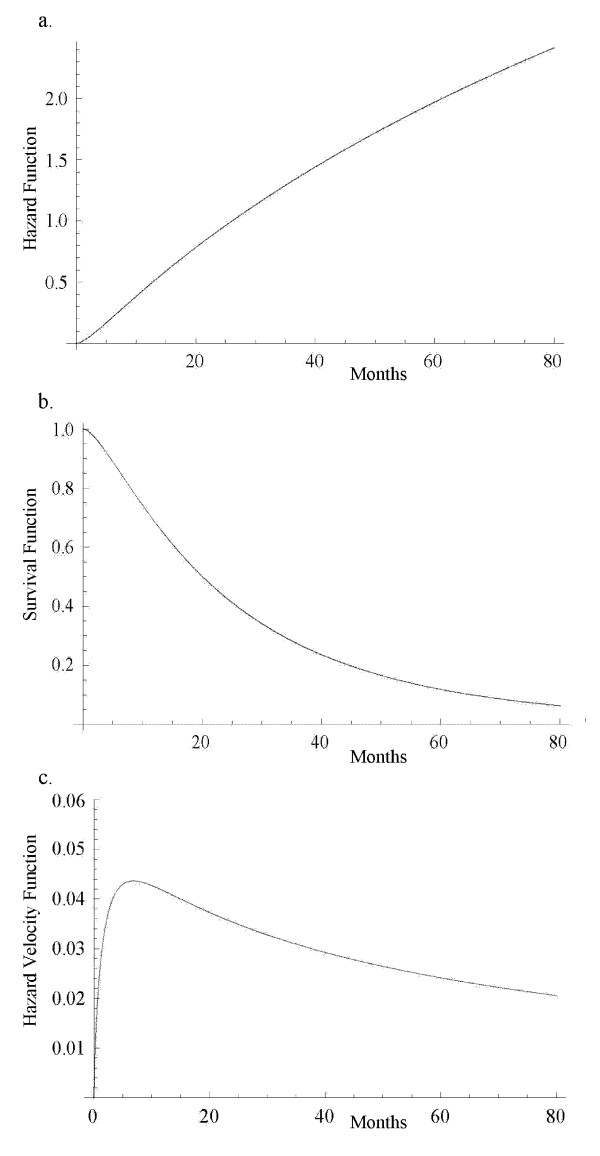
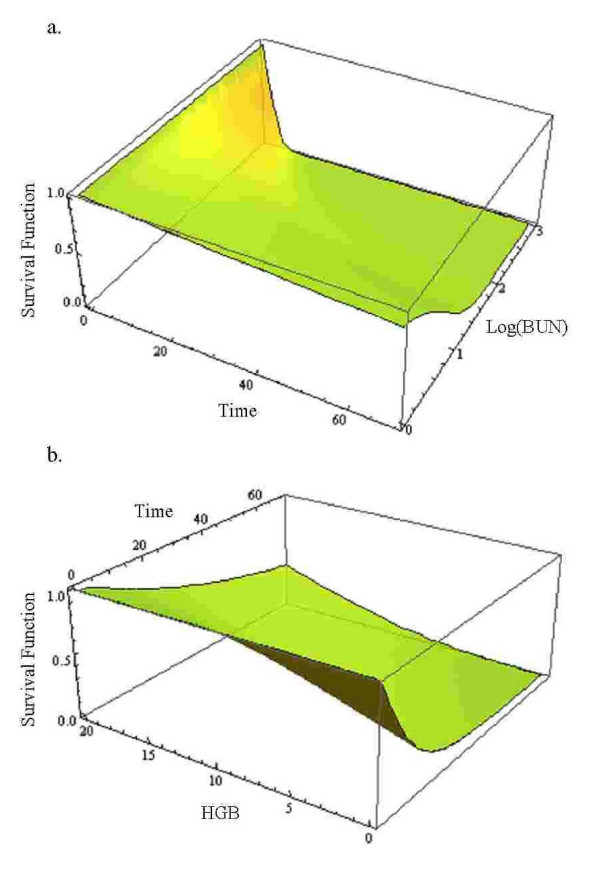
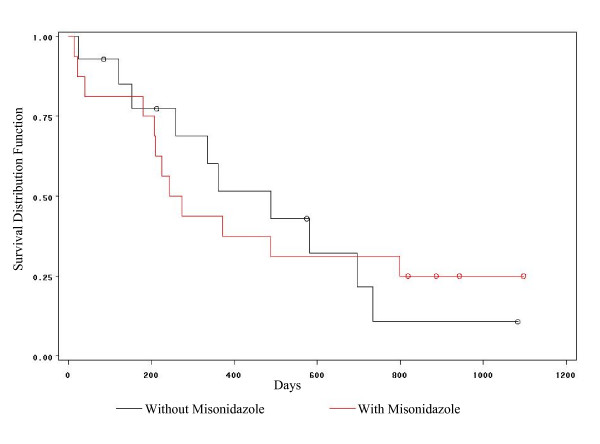
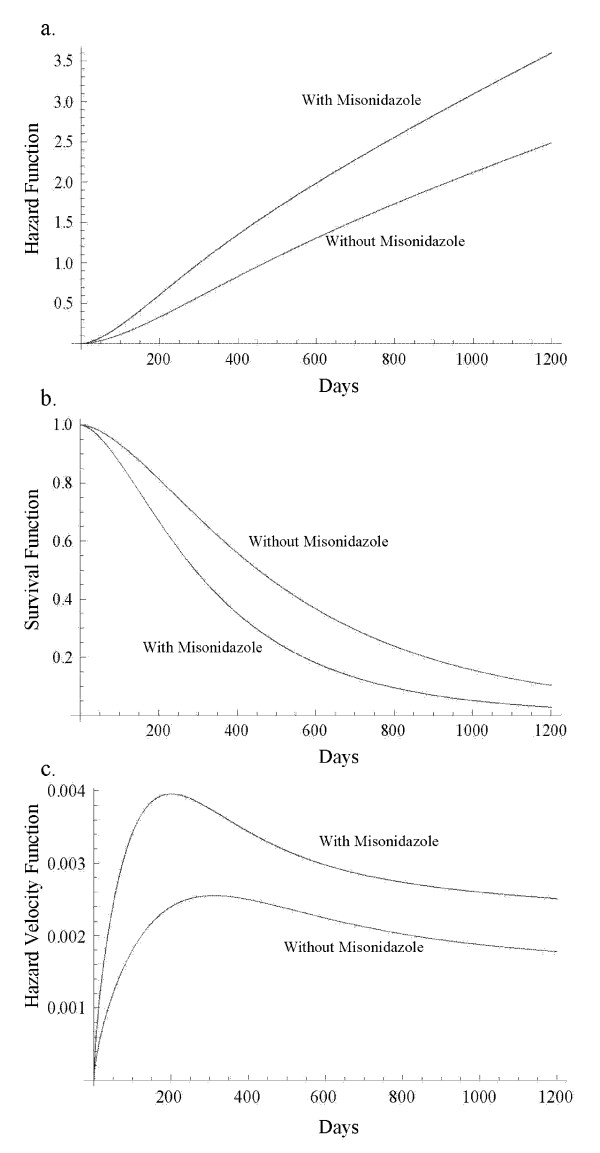
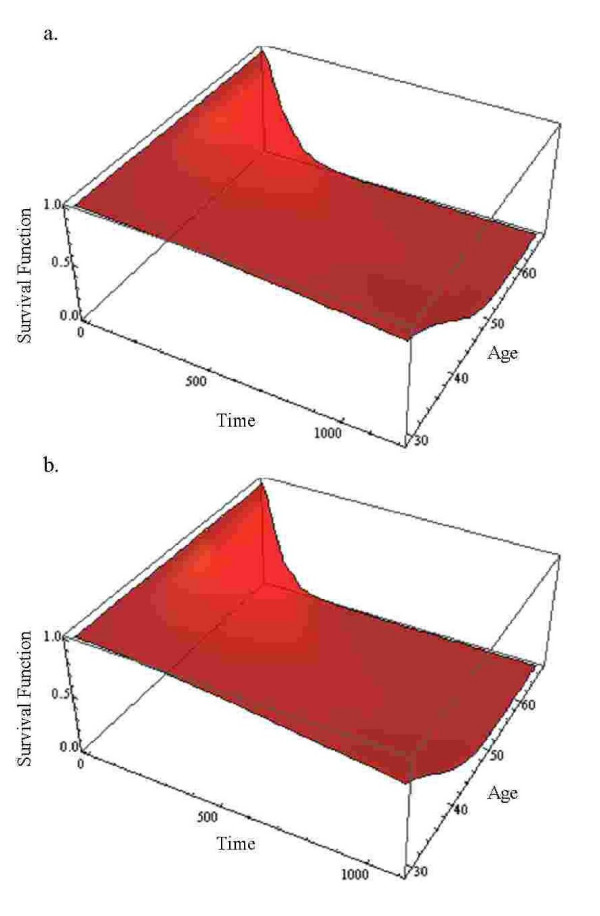
A new two-parameter probability distribution called hypertabastic is introduced to model the survival or time-to-event data. A simulation study was carried out to evaluate the performance of the hypertabastic distribution in comparison with popular distributions. We then demonstrate the application of the hypertabastic survival model by applying it to data from two motivating studies. The first one demonstrates the proportional hazards version of the model by applying it to a data set from multiple myeloma study. The second one demonstrates an accelerated failure time version of the model by applying it to data from a randomized study of glioma patients who underwent radiotherapy treatment with and without radiosensitizer misonidazole. Based on the results from the simulation study and two applications, the proposed model shows to be a flexible and promising alternative to practitioners in this field.
Figures
Similar articles
-
Clinical and multiple gene expression variables in survival analysis of breast cancer: analysis with the hypertabastic survival model.BMC Med Genomics. 2012 Dec 14;5:63. doi: 10.1186/1755-8794-5-63. BMC Med Genomics. 2012. PMID: 23241496 Free PMC article.
-
Accelerated hazards regression model and its adequacy for censored survival data.Biometrics. 2001 Sep;57(3):853-60. doi: 10.1111/j.0006-341x.2001.00853.x. Biometrics. 2001. PMID: 11550937
-
Comparison of hypertabastic survival model with other unimodal hazard rate functions using a goodness-of-fit test.Stat Med. 2017 May 30;36(12):1936-1945. doi: 10.1002/sim.7244. Epub 2017 Feb 7. Stat Med. 2017. PMID: 28173610
-
Rationale for carbon ion therapy in high-grade glioma based on a review and a meta-analysis of neutron beam trials.Cancer Radiother. 2010 Jan;14(1):34-41. doi: 10.1016/j.canrad.2009.08.141. Epub 2009 Dec 8. Cancer Radiother. 2010. PMID: 20004126 Review.
-
Prognostic role of survivin in patients with glioma.Medicine (Baltimore). 2018 Apr;97(17):e0571. doi: 10.1097/MD.0000000000010571. Medicine (Baltimore). 2018. PMID: 29703049 Free PMC article. Review.
Cited by
-
Clinical and multiple gene expression variables in survival analysis of breast cancer: analysis with the hypertabastic survival model.BMC Med Genomics. 2012 Dec 14;5:63. doi: 10.1186/1755-8794-5-63. BMC Med Genomics. 2012. PMID: 23241496 Free PMC article.
-
The role of histological subtypes in the survival of patients diagnosed with cutaneous or mucosal melanoma in the United States of America.PLoS One. 2023 Jun 5;18(6):e0286538. doi: 10.1371/journal.pone.0286538. eCollection 2023. PLoS One. 2023. PMID: 37276224 Free PMC article.
-
A Comprehensive Analysis of the Effect of Histological Subtypes on the Survival Probability of Kidney Carcinoma Patients: A Hypertabastic Survival Analysis.J Ren Cancer. 2020;3(1):20-33. doi: 10.36959/896/604. Epub 2020 Dec 28. J Ren Cancer. 2020. PMID: 39450304 Free PMC article.
-
Identification of Bridge Key Performance Indicators Using Survival Analysis for Future Network-Wide Structural Health Monitoring.Sensors (Basel). 2020 Dec 2;20(23):6894. doi: 10.3390/s20236894. Sensors (Basel). 2020. PMID: 33276606 Free PMC article.
-
Complete hazard ranking to analyze right-censored data: An ALS survival study.PLoS Comput Biol. 2017 Dec 18;13(12):e1005887. doi: 10.1371/journal.pcbi.1005887. eCollection 2017 Dec. PLoS Comput Biol. 2017. PMID: 29253881 Free PMC article.
References
-
- Hosmer DW, Lemeshow S. Applied Survival Analysis: Regression Modeling of Time to Event Data. New York: Wiley; 1999.
-
- Lee ET, Wang JW. Statistical Methods for Survival Data Analysis. 3. New York: Wiley; 2003.
-
- Kleinbaum DG, Klein M. Survival Analysis: A Self-learning Text. 2. New York: Springer; 2005.
-
- Collet D. Modeling Survival Data in Medical Research. New York: Chapman and Hall/CRC; 1994.
-
- Cox DR. Regression Models and Life Tables. Journal of the Royal Statistical Society, Ser B. 1972;34:187–220.
Publication types
MeSH terms
LinkOut - more resources
Full Text Sources
Medical
