

Prediction potential of candidate biomarker sets identified and validated on gene expression data from multiple datasets
- PMID: 17963508
- PMCID: PMC2211325
- DOI: 10.1186/1471-2105-8-415
Prediction potential of candidate biomarker sets identified and validated on gene expression data from multiple datasets
Abstract
Background: Independently derived expression profiles of the same biological condition often have few genes in common. In this study, we created populations of expression profiles from publicly available microarray datasets of cancer (breast, lymphoma and renal) samples linked to clinical information with an iterative machine learning algorithm. ROC curves were used to assess the prediction error of each profile for classification. We compared the prediction error of profiles correlated with molecular phenotype against profiles correlated with relapse-free status. Prediction error of profiles identified with supervised univariate feature selection algorithms were compared to profiles selected randomly from a) all genes on the microarray platform and b) a list of known disease-related genes (a priori selection). We also determined the relevance of expression profiles on test arrays from independent datasets, measured on either the same or different microarray platforms.
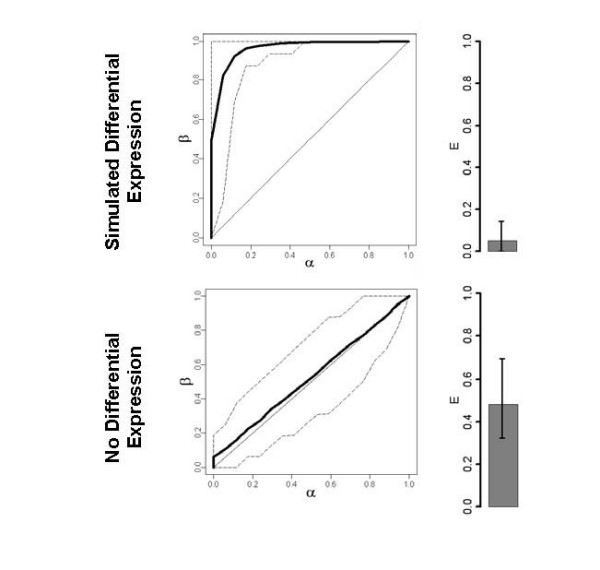
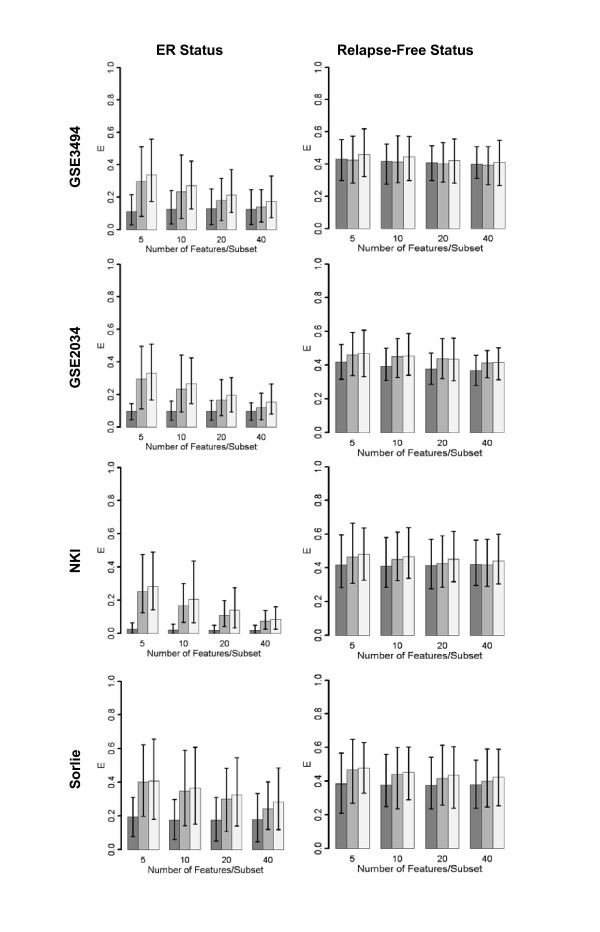
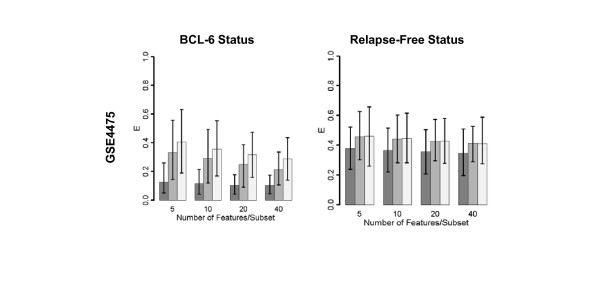
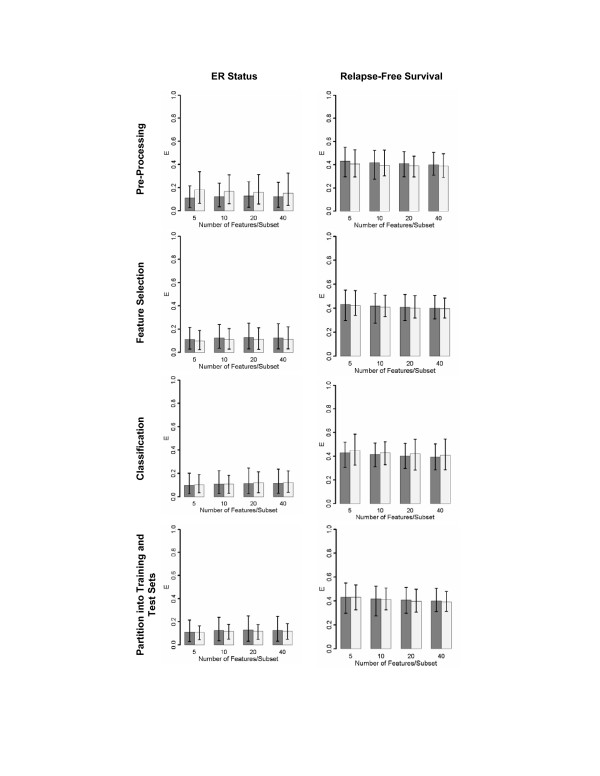
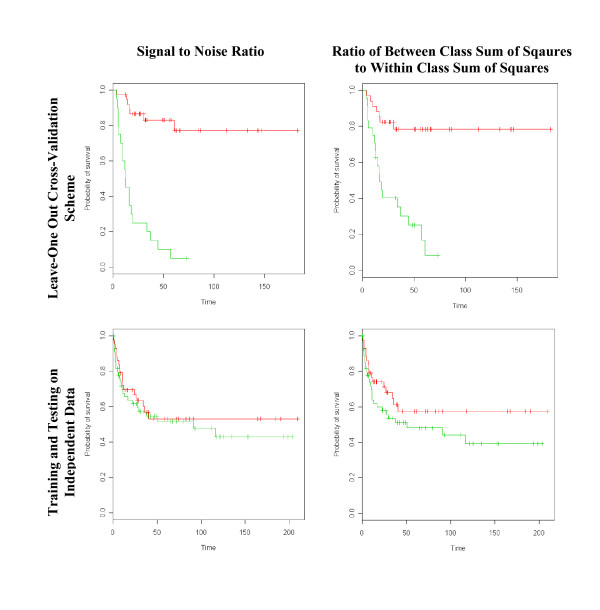
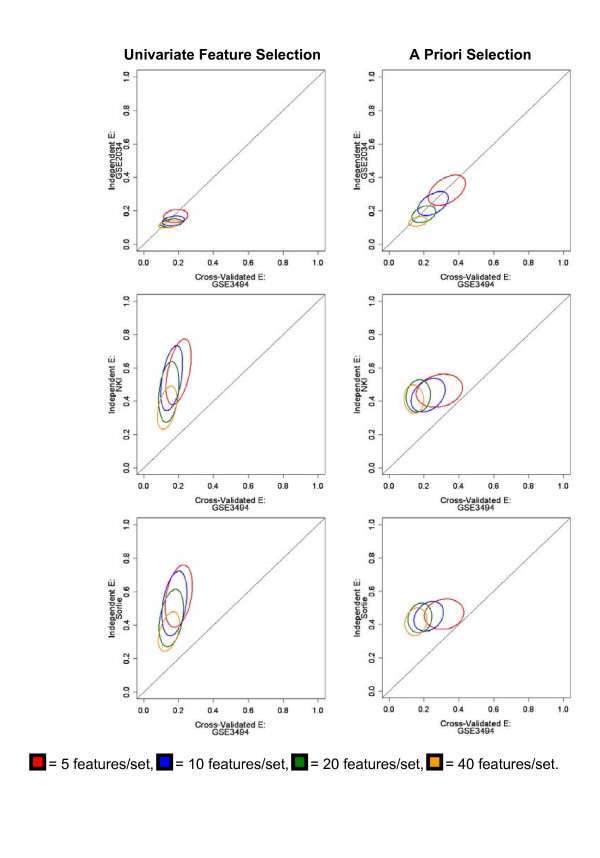
Results: Highly discriminative expression profiles were produced on both simulated gene expression data and expression data from breast cancer and lymphoma datasets on the basis of ER and BCL-6 expression, respectively. Use of relapse-free status to identify profiles for prognosis prediction resulted in poorly discriminative decision rules. Supervised feature selection resulted in more accurate classifications than random or a priori selection, however, the difference in prediction error decreased as the number of features increased. These results held when decision rules were applied across-datasets to samples profiled on the same microarray platform.
Conclusion: Our results show that many gene sets predict molecular phenotypes accurately. Given this, expression profiles identified using different training datasets should be expected to show little agreement. In addition, we demonstrate the difficulty in predicting relapse directly from microarray data using supervised machine learning approaches. These findings are relevant to the use of molecular profiling for the identification of candidate biomarker panels.
Figures
Similar articles
-
Tumor classification ranking from microarray data.BMC Genomics. 2008 Sep 16;9 Suppl 2(Suppl 2):S21. doi: 10.1186/1471-2164-9-S2-S21. BMC Genomics. 2008. PMID: 18831787 Free PMC article.
-
Comparison and evaluation of methods for generating differentially expressed gene lists from microarray data.BMC Bioinformatics. 2006 Jul 26;7:359. doi: 10.1186/1471-2105-7-359. BMC Bioinformatics. 2006. PMID: 16872483 Free PMC article.
-
Biomarker discovery across annotated and unannotated microarray datasets using semi-supervised learning.BMC Genomics. 2008 Sep 16;9 Suppl 2(Suppl 2):S7. doi: 10.1186/1471-2164-9-S2-S7. BMC Genomics. 2008. PMID: 18831798 Free PMC article.
-
Filter versus wrapper gene selection approaches in DNA microarray domains.Artif Intell Med. 2004 Jun;31(2):91-103. doi: 10.1016/j.artmed.2004.01.007. Artif Intell Med. 2004. PMID: 15219288 Review.
-
Classification algorithms for phenotype prediction in genomics and proteomics.Front Biosci. 2008 Jan 1;13:691-708. doi: 10.2741/2712. Front Biosci. 2008. PMID: 17981580 Free PMC article. Review.
Cited by
-
Meta-analysis approach as a gene selection method in class prediction: does it improve model performance? A case study in acute myeloid leukemia.BMC Bioinformatics. 2017 Apr 11;18(1):210. doi: 10.1186/s12859-017-1619-7. BMC Bioinformatics. 2017. PMID: 28399794 Free PMC article.
-
Development of phenotypic and transcriptional biomarkers to evaluate relative activity of potentially estrogenic chemicals in ovariectomized mice.Environ Health Perspect. 2015 Apr;123(4):344-52. doi: 10.1289/ehp.1307935. Epub 2015 Jan 9. Environ Health Perspect. 2015. PMID: 25575267 Free PMC article.
-
Predictive gene lists for breast cancer prognosis: a topographic visualisation study.BMC Med Genomics. 2008 Apr 17;1:8. doi: 10.1186/1755-8794-1-8. BMC Med Genomics. 2008. PMID: 18419801 Free PMC article.
-
Modular composition predicts kinase/substrate interactions.BMC Bioinformatics. 2010 Jun 25;11:349. doi: 10.1186/1471-2105-11-349. BMC Bioinformatics. 2010. PMID: 20579376 Free PMC article.
-
Introducing Serine as Cardiovascular Disease Biomarker Candidate via Pathway Analysis.Galen Med J. 2020 Feb 10;9:e1696. doi: 10.31661/gmj.v9i0.1696. eCollection 2020. Galen Med J. 2020. PMID: 34466570 Free PMC article.
References
-
- Bertucci F, Viens P, Tageet R, Nguyen C, Houlgatte R, Birnbaum D. DNA Arrays in Clinical Oncology: Promises and Challenges. Lab Invest. 2003;83:305–316. - PubMed
Publication types
MeSH terms
Substances
Grants and funding
LinkOut - more resources
Full Text Sources
