Comparative transcriptomics in Yersinia pestis: a global view of environmental modulation of gene expression
- PMID: 17963531
- PMCID: PMC2231364
- DOI: 10.1186/1471-2180-7-96
Comparative transcriptomics in Yersinia pestis: a global view of environmental modulation of gene expression
Abstract
Background: Environmental modulation of gene expression in Yersinia pestis is critical for its life style and pathogenesis. Using cDNA microarray technology, we have analyzed the global gene expression of this deadly pathogen when grown under different stress conditions in vitro.
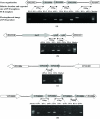
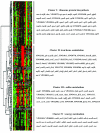
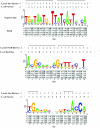
Results: To provide us with a comprehensive view of environmental modulation of global gene expression in Y. pestis, we have analyzed the gene expression profiles of 25 different stress conditions. Almost all known virulence genes of Y. pestis were differentially regulated under multiple environmental perturbations. Clustering enabled us to functionally classify co-expressed genes, including some uncharacterized genes. Collections of operons were predicted from the microarray data, and some of these were confirmed by reverse-transcription polymerase chain reaction (RT-PCR). Several regulatory DNA motifs, probably recognized by the regulatory protein Fur, PurR, or Fnr, were predicted from the clustered genes, and a Fur binding site in the corresponding promoter regions was verified by electrophoretic mobility shift assay (EMSA).
Conclusion: The comparative transcriptomics analysis we present here not only benefits our understanding of the molecular determinants of pathogenesis and cellular regulatory circuits in Y. pestis, it also serves as a basis for integrating increasing volumes of microarray data using existing methods.
Figures


Similar articles
-
The iron-responsive Fur regulon in Yersinia pestis.J Bacteriol. 2008 Apr;190(8):3063-75. doi: 10.1128/JB.01910-07. Epub 2008 Feb 15. J Bacteriol. 2008. PMID: 18281395 Free PMC article.
-
Characterization of Zur-dependent genes and direct Zur targets in Yersinia pestis.BMC Microbiol. 2009 Jun 25;9:128. doi: 10.1186/1471-2180-9-128. BMC Microbiol. 2009. PMID: 19552825 Free PMC article.
-
Phenotypic and transcriptional analysis of the osmotic regulator OmpR in Yersinia pestis.BMC Microbiol. 2011 Feb 23;11:39. doi: 10.1186/1471-2180-11-39. BMC Microbiol. 2011. PMID: 21345178 Free PMC article.
-
Genetic Regulation of Yersinia pestis.Adv Exp Med Biol. 2016;918:223-256. doi: 10.1007/978-94-024-0890-4_8. Adv Exp Med Biol. 2016. PMID: 27722865 Review.
-
Transcriptional regulation of Yersinia pestis biofilm formation.Microb Pathog. 2019 Jun;131:212-217. doi: 10.1016/j.micpath.2019.04.011. Epub 2019 Apr 10. Microb Pathog. 2019. PMID: 30980880 Review.
Cited by
-
The iron-responsive Fur regulon in Yersinia pestis.J Bacteriol. 2008 Apr;190(8):3063-75. doi: 10.1128/JB.01910-07. Epub 2008 Feb 15. J Bacteriol. 2008. PMID: 18281395 Free PMC article.
-
Evaluation of the humoral immune response in mice orally vaccinated with live recombinant attenuated Salmonella enterica delivering a secreted form of Yersinia pestis PsaA.Vaccine. 2010 Aug 16;28(36):5810-6. doi: 10.1016/j.vaccine.2010.06.070. Epub 2010 Jul 13. Vaccine. 2010. PMID: 20600475 Free PMC article.
-
Yersinia pestis and Plague: some knowns and unknowns.Zoonoses. 2023;3(1):5. doi: 10.15212/zoonoses-2022-0040. Epub 2023 Jan 19. Zoonoses. 2023. PMID: 37602146 Free PMC article.
-
Low Cytoplasmic Magnesium Increases the Specificity of the Lon and ClpAP Proteases.J Bacteriol. 2021 Jun 22;203(14):e0014321. doi: 10.1128/JB.00143-21. Epub 2021 Jun 22. J Bacteriol. 2021. PMID: 33941609 Free PMC article.
-
hARACNe: improving the accuracy of regulatory model reverse engineering via higher-order data processing inequality tests.Interface Focus. 2013 Aug 6;3(4):20130011. doi: 10.1098/rsfs.2013.0011. Interface Focus. 2013. PMID: 24511376 Free PMC article.
References
-
- Hinnebusch BJ. The evolution of flea-borne transmission in Yersinia pestis. Curr Issues Mol Biol. 2005;7:197–212. - PubMed
Publication types
MeSH terms
Substances
LinkOut - more resources
Full Text Sources
Molecular Biology Databases

