

Selective modulation of promoter recruitment and transcriptional activity of PPARgamma
- PMID: 17963725
- PMCID: PMC2585742
- DOI: 10.1016/j.bbrc.2007.10.057
Selective modulation of promoter recruitment and transcriptional activity of PPARgamma
Abstract
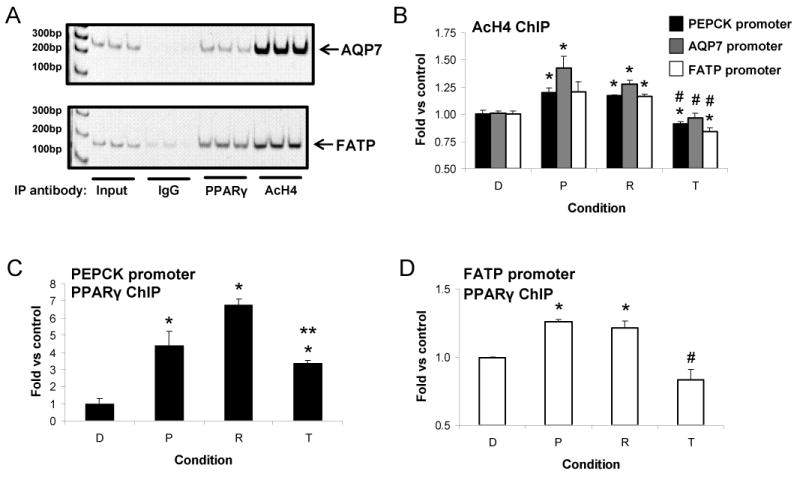
Peroxisome proliferator-activated receptor gamma (PPARgamma) is a nuclear receptor regulated by the insulin-sensitizing thiazolidinediones (TZDs). We studied selective modulation of endogenous genes by PPARgamma ligands using microarray, RNA expression kinetics, and chromatin immunoprecipitation (ChIP) in 3T3-L1 adipocytes. We found over 300 genes that were significantly regulated the TZDs pioglitazone, rosiglitazone, and troglitazone. TZD-mediated expression profiles were unique but overlapping. Ninety-one genes were commonly regulated by all three ligands. TZD time course and dose-response studies revealed gene- and TZD-specific expression kinetics. PEPCK expression was induced rapidly but PDK4 expression was induced gradually. Troglitazone EC50 values for PEPCK, PDK4, and RGS2 regulation were greater than those for pioglitazone and rosiglitazone. TZDs differentially induced histone acetylation of and PPARgamma recruitment to target gene promoters. Selective modulation of PPARgamma by TZDs resulted in distinct expression profiles and transcription kinetics which may be due to differential promoter activation and chromatin remodeling of target genes.
Figures


Similar articles
-
Peroxisome proliferator-activated receptor gamma regulates expression of the anti-lipolytic G-protein-coupled receptor 81 (GPR81/Gpr81).J Biol Chem. 2009 Sep 25;284(39):26385-93. doi: 10.1074/jbc.M109.040741. Epub 2009 Jul 24. J Biol Chem. 2009. PMID: 19633298 Free PMC article.
-
Dynamics of HOX gene expression and regulation in adipocyte development.Gene. 2021 Feb 5;768:145308. doi: 10.1016/j.gene.2020.145308. Epub 2020 Nov 13. Gene. 2021. PMID: 33197517
-
Trichostatin A modulates thiazolidinedione-mediated suppression of tumor necrosis factor α-induced lipolysis in 3T3-L1 adipocytes.PLoS One. 2013 Aug 9;8(8):e71517. doi: 10.1371/journal.pone.0071517. eCollection 2013. PLoS One. 2013. PMID: 23951179 Free PMC article.
-
Toxicological consequences of altered peroxisome proliferator-activated receptor gamma (PPARgamma) expression in the liver: insights from models of obesity and type 2 diabetes.Biochem Pharmacol. 2002 Jan 1;63(1):1-10. doi: 10.1016/s0006-2952(01)00817-6. Biochem Pharmacol. 2002. PMID: 11754868 Review.
-
Epigenetic codes of PPARγ in metabolic disease.FEBS Lett. 2011 Jul 7;585(13):2121-8. doi: 10.1016/j.febslet.2011.05.007. Epub 2011 May 19. FEBS Lett. 2011. PMID: 21605560 Free PMC article. Review.
Cited by
-
Nuclear receptors and epigenetic regulation: opportunities for nutritional targeting and disease prevention.Adv Nutr. 2014 Jul 14;5(4):373-85. doi: 10.3945/an.114.005868. Print 2014 Jul. Adv Nutr. 2014. PMID: 25022987 Free PMC article. Review.
-
Regulation of chemokine and chemokine receptor expression by PPARγ in adipocytes and macrophages.PLoS One. 2012;7(4):e34976. doi: 10.1371/journal.pone.0034976. Epub 2012 Apr 17. PLoS One. 2012. PMID: 22529965 Free PMC article.
-
Pyruvate dehydrogenase kinase 4: regulation by thiazolidinediones and implication in glyceroneogenesis in adipose tissue.Diabetes. 2008 Sep;57(9):2272-9. doi: 10.2337/db08-0477. Epub 2008 Jun 2. Diabetes. 2008. PMID: 18519799 Free PMC article.
-
Additional sex comb-like (ASXL) proteins 1 and 2 play opposite roles in adipogenesis via reciprocal regulation of peroxisome proliferator-activated receptor {gamma}.J Biol Chem. 2011 Jan 14;286(2):1354-63. doi: 10.1074/jbc.M110.177816. Epub 2010 Nov 3. J Biol Chem. 2011. PMID: 21047783 Free PMC article.
-
Rosiglitazone treatment reduces diabetic neuropathy in streptozotocin-treated DBA/2J mice.Endocrinology. 2008 Oct;149(10):4928-37. doi: 10.1210/en.2008-0869. Epub 2008 Jun 26. Endocrinology. 2008. PMID: 18583417 Free PMC article.
References
-
- Olefsky JM, Saltiel AR. PPARγ and the Treatment of Insulin Resistance. Trends in Endocrinology and Metabolism. 2000;11:362–368. - PubMed
-
- Berger JP, Petro AE, Macnaul KL, et al. Distinct properties and advantages of a novel PPARγ selective modulator. Mol Endocrinol. 2003;17:662–676. - PubMed
-
- Way JM, Harrington WW, Brown KK, et al. Comprehensive messenger ribonucleic acid profiling reveals that PPARγ activation has coordinate effects on gene expression in multiple insulin-sensitive tissues. Endocrinology. 2001;142:1269–1277. - PubMed
-
- Huang J, Hsia SH, Imamura T, et al. Annexin II is a thiazolidinedione-responsive gene involved in insulin-induced glucose transporter isoform 4 translocation in 3T3-L1 adipocytes. Endocrinology. 2004;145:1579–1586. - PubMed
Publication types
MeSH terms
Substances
Grants and funding
LinkOut - more resources
Full Text Sources
Other Literature Sources
