

Factors associated with intraocular pressure before and during 9 years of treatment in the Collaborative Initial Glaucoma Treatment Study
- PMID: 17964655
- PMCID: PMC2758572
- DOI: 10.1016/j.ophtha.2007.08.010
Factors associated with intraocular pressure before and during 9 years of treatment in the Collaborative Initial Glaucoma Treatment Study
Abstract
Purpose: To evaluate, both at initial glaucoma diagnosis and during treatment, the role of demographic and clinical factors on intraocular pressure (IOP).
Design: Cohort study of patients enrolled in a randomized clinical trial.
Participants: Six hundred seven patients with newly diagnosed open-angle glaucoma (OAG) were enrolled at 14 centers in the United States.
Methods: After randomization to initial surgery or medications, patients were followed at 6-month intervals. Intraocular pressure was measured by Goldmann applanation tonometry. Predictive factors for IOP at baseline and during follow-up were analyzed using linear mixed models.
Main outcome measure: Intraocular pressure at baseline and during follow-up.
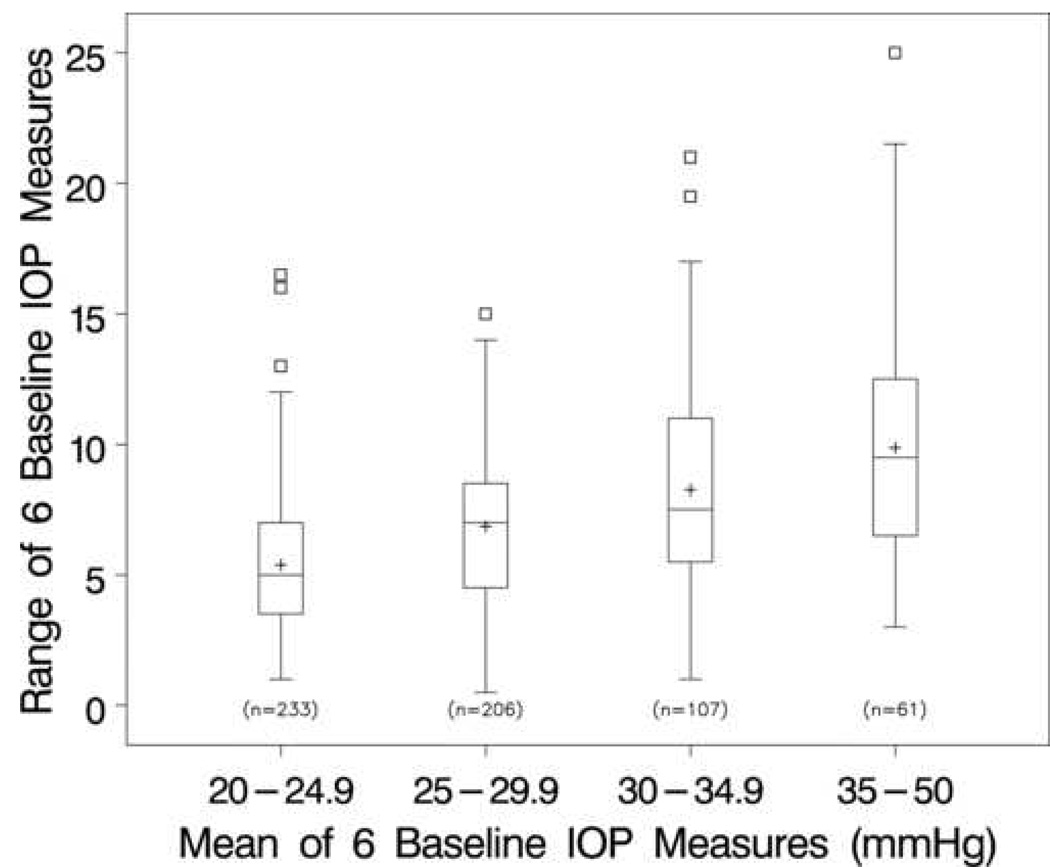
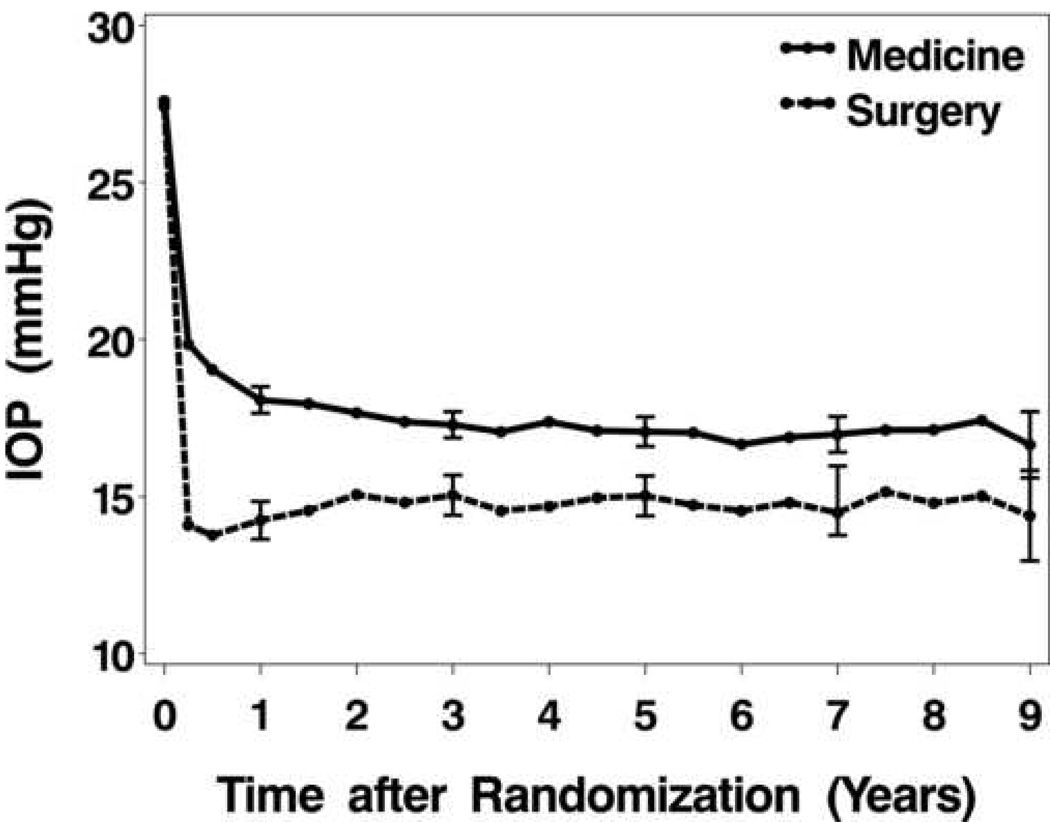
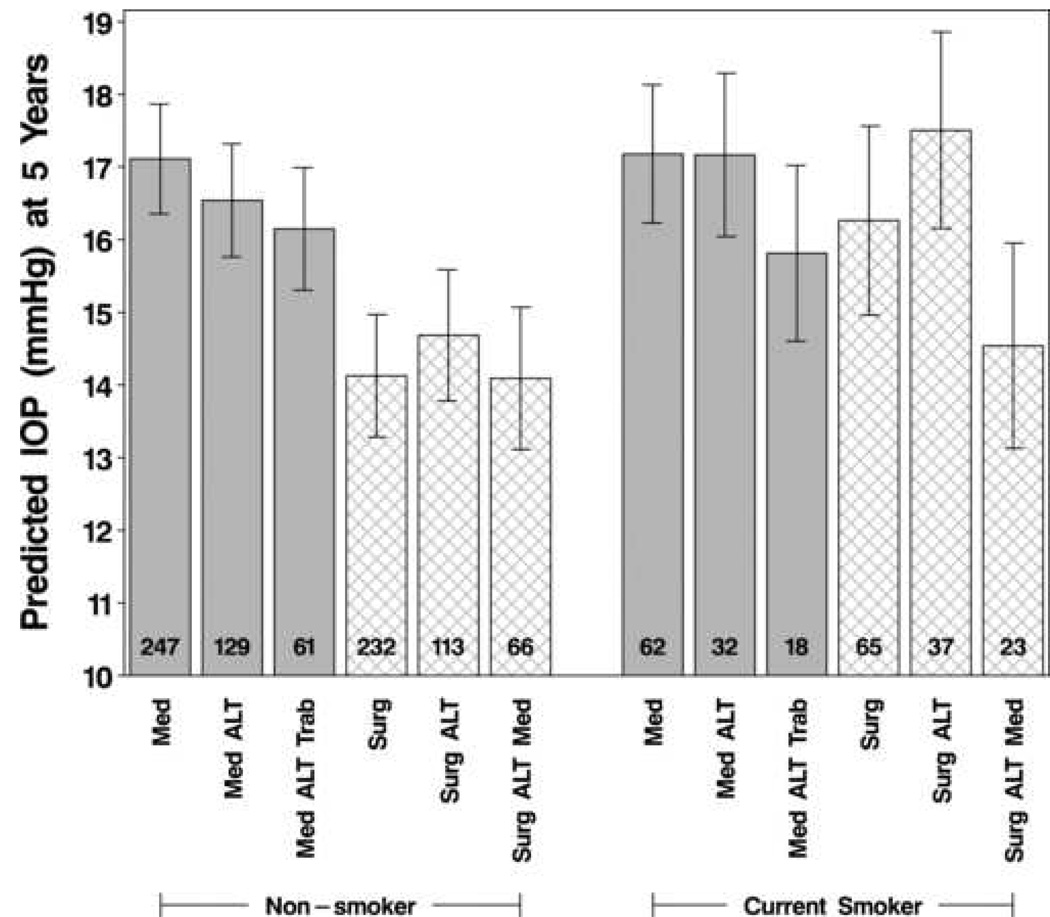
Results: The mean baseline IOP was 27.5 mmHg (standard deviation, 5.6 mmHg). Predictive factors for higher baseline IOP included younger age (0.7 mmHg per 10 years), male gender (2.4 mmHg higher than females), pseudoexfoliative glaucoma (5.4 mmHg higher than primary OAG), and pupillary defect (2.2 mmHg higher than those without a defect). During 9 years of follow-up, both surgery and medications dramatically reduced IOP from baseline levels, but the extent of IOP reduction was consistently greater in the surgery group. Over follow-up years 2 through 9, mean IOP was 15.0 versus 17.2 mmHg for surgery versus medicine, respectively. Predictive associations with higher IOP during follow-up included higher baseline IOP (P<0.0001), worse baseline visual field (mean deviation; P<0.0001), and lower level of education (P = 0.0019). Treatment effect was modified by smoking status: nonsmokers treated surgically had lower IOP than smokers treated surgically (14.6 vs. 16.7 mmHg, respectively; P = 0.0013). Clinical center effects were significant (P<0.0001) in both the baseline and follow-up models.
Conclusions: In this large cohort of newly diagnosed glaucoma patients, predictors of pretreatment IOP and IOP measurements over 9 years of follow-up were identified. Our findings lend credence to the postulate that sociodemographic, economic, compliance, or other environmental influences play a role in IOP control during treatment.
Figures
References
-
- AGIS Investigators. The Advanced Glaucoma Intervention Study (AGIS): 7. The relationship between control of intraocular pressure and visual field deterioration. Am J Ophthalmol. 2000;130:429–440. - PubMed
-
- Leske MC, Heijl A, Hussein M, et al. Early Manifest Glaucoma Trial Group. Factors for glaucoma progression and the effect of treatment: the Early Manifest Glaucoma Trial. Arch Ophthalmol. 2003;121:48–56. - PubMed
-
- Gordon MO, Beiser JA, Brandt JD, et al. Ocular Hypertension Treatment Study Group. The Ocular Hypertension Treatment Study: baseline factors that predict the onset of primary open-angle glaucoma. Arch Ophthalmol. 2002;120:714–720. - PubMed
-
- Armaly MF. On the distribution of applanation pressure. I. Statistical features and the effect of age, sex, and family history of glaucoma. Arch Ophthalmol. 1965;73:11–18. - PubMed
-
- Klein BE, Klein R. Intraocular pressure and cardiovascular risk variables. Arch Ophthalmol. 1981;99:837–839. - PubMed
Publication types
MeSH terms
Substances
Grants and funding
LinkOut - more resources
Full Text Sources
