

Effects of neonatal amygdala or hippocampus lesions on resting brain metabolism in the macaque monkey: a microPET imaging study
- PMID: 17964814
- PMCID: PMC2527971
- DOI: 10.1016/j.neuroimage.2007.09.029
Effects of neonatal amygdala or hippocampus lesions on resting brain metabolism in the macaque monkey: a microPET imaging study
Abstract
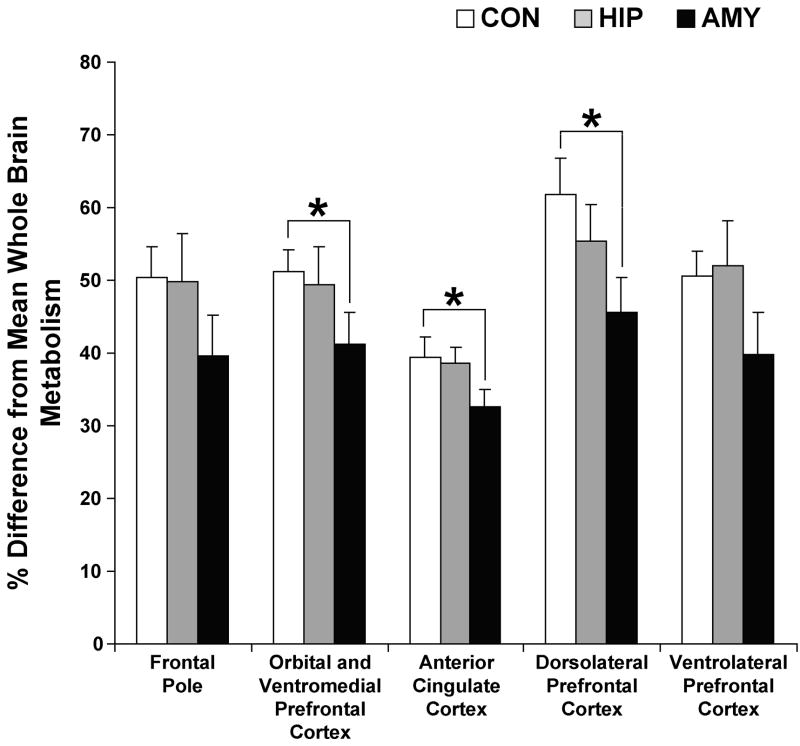
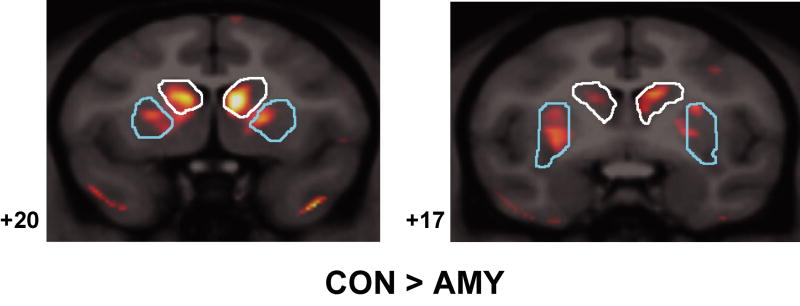
Longitudinal analysis of animals with neonatal brain lesions enables the evaluation of behavioral changes during multiple stages of development. Interpretation of such changes, however, carries the caveat that permanent neural injury also yields morphological and neurochemical reorganization elsewhere in the brain that may lead either to functional compensation or to exacerbation of behavioral alterations. We have measured the long-term effects of selective neonatal brain damage on resting cerebral glucose metabolism in nonhuman primates. Sixteen rhesus monkeys (Macaca mulatta) received neurotoxic lesions of either the amygdala (n=8) or hippocampus (n=8) when they were two weeks old. Four years later, these animals, along with age- and experience-matched sham-operated control animals (n=8), were studied with high-resolution positron emission tomography (microPET) and 2-deoxy-2[(18)F]fluoro-d-glucose ([(18)F]FDG) to detect areas of altered metabolism. The groups were compared using an anatomically-based region of interest analysis. Relative to controls, amygdala-lesioned animals displayed hypometabolism in three frontal lobe regions, as well as in the neostriatum and hippocampus. Hypermetabolism was also evident in the cerebellum of amygdala-lesioned animals. Hippocampal-lesioned animals only showed hypometabolism in the retrosplenial cortex. These results indicate that neonatal amygdala and hippocampus lesions induce very different patterns of long-lasting metabolic changes in distant brain regions. These observations raise the possibility that behavioral alterations in animals with neonatal lesions may be due to the intended damage, to consequent brain reorganization or to a combination of both factors.
Figures


Similar articles
-
Cerebral metabolic consequences in the adult brain after neonatal excitotoxic lesions of the amygdala in rats.Eur Neuropsychopharmacol. 2006 Jul;16(5):358-65. doi: 10.1016/j.euroneuro.2005.11.005. Epub 2005 Dec 13. Eur Neuropsychopharmacol. 2006. PMID: 16356694
-
Neural Reorganization Due to Neonatal Amygdala Lesions in the Rhesus Monkey: Changes in Morphology and Network Structure.Cereb Cortex. 2017 Jun 1;27(6):3240-3253. doi: 10.1093/cercor/bhx080. Cereb Cortex. 2017. PMID: 28383709 Free PMC article.
-
18 F-2-fluoro-2-deoxy-D-glucose-positron emission tomography metabolic pattern assessment in the brain of betel quid dependent individuals.Addict Biol. 2021 Sep;26(5):e13043. doi: 10.1111/adb.13043. Epub 2021 Apr 28. Addict Biol. 2021. PMID: 33908137
-
Emergence of stereotypies in juvenile monkeys (Macaca mulatta) with neonatal amygdala or hippocampus lesions.Behav Neurosci. 2008 Oct;122(5):1005-15. doi: 10.1037/a0012600. Behav Neurosci. 2008. PMID: 18823158 Free PMC article.
-
Imaging Brain Metabolism in the Newborn.J Child Neurol. 2018 Nov;33(13):851-860. doi: 10.1177/0883073818792308. Epub 2018 Aug 16. J Child Neurol. 2018. PMID: 30112963 Review.
Cited by
-
Relationships between hippocampal atrophy, white matter disruption, and gray matter hypometabolism in Alzheimer's disease.J Neurosci. 2008 Jun 11;28(24):6174-81. doi: 10.1523/JNEUROSCI.1392-08.2008. J Neurosci. 2008. PMID: 18550759 Free PMC article.
-
Behavioral depression is associated with increased vagally mediated heart rate variability in adult female cynomolgus monkeys (Macaca fascicularis).Int J Psychophysiol. 2018 Sep;131:139-143. doi: 10.1016/j.ijpsycho.2017.11.004. Epub 2017 Nov 8. Int J Psychophysiol. 2018. PMID: 29128294 Free PMC article.
-
MRI Overestimates Excitotoxic Amygdala Lesion Damage in Rhesus Monkeys.Front Integr Neurosci. 2017 Jun 8;11:12. doi: 10.3389/fnint.2017.00012. eCollection 2017. Front Integr Neurosci. 2017. PMID: 28642691 Free PMC article.
-
Diffusion tensor imaging reveals microstructural alterations in corpus callosum and associated transcallosal fiber tracts in adult macaques with neonatal hippocampal lesions.Hippocampus. 2018 Nov;28(11):838-845. doi: 10.1002/hipo.23006. Hippocampus. 2018. PMID: 29978933 Free PMC article.
-
Dispositional negativity: An integrative psychological and neurobiological perspective.Psychol Bull. 2016 Dec;142(12):1275-1314. doi: 10.1037/bul0000073. Epub 2016 Oct 10. Psychol Bull. 2016. PMID: 27732016 Free PMC article. Review.
References
-
- Alkire MT, Haier RJ, Shah NK, Anderson CT. Positron emission tomography study of regional cerebral metabolism in humans during isoflurane anesthesia. Anesthesiology. 1997;86:549–557. - PubMed
-
- Alvarado MC, Bachevalier J. Revisiting the maturation of medial temporal lobe memory functions in primates. Learning & Memory. 2000;7:244–256. - PubMed
-
- Amaral DG, Price JL, Pitkänen A, Carmichael ST, Aggleton JP. The Amygdala: Neurobiological Aspects of Emotion, Memory, and Mental Dysfunction. John Wiley & Sons; New York: 1992. Anatomical organization of the primate amygdaloid complex; pp. 1–66.
Publication types
MeSH terms
Substances
Grants and funding
LinkOut - more resources
Full Text Sources
