. 2008 Feb 1;160(2):147-59.
doi: 10.1016/j.resp.2007.09.006. Epub 2007 Sep 16.

Hypercapnia modulates synaptic interaction of cultured brainstem neurons

Affiliations

Hypercapnia modulates synaptic interaction of cultured brainstem neurons

Liang Yang et al. Respir Physiol Neurobiol. .

Abstract

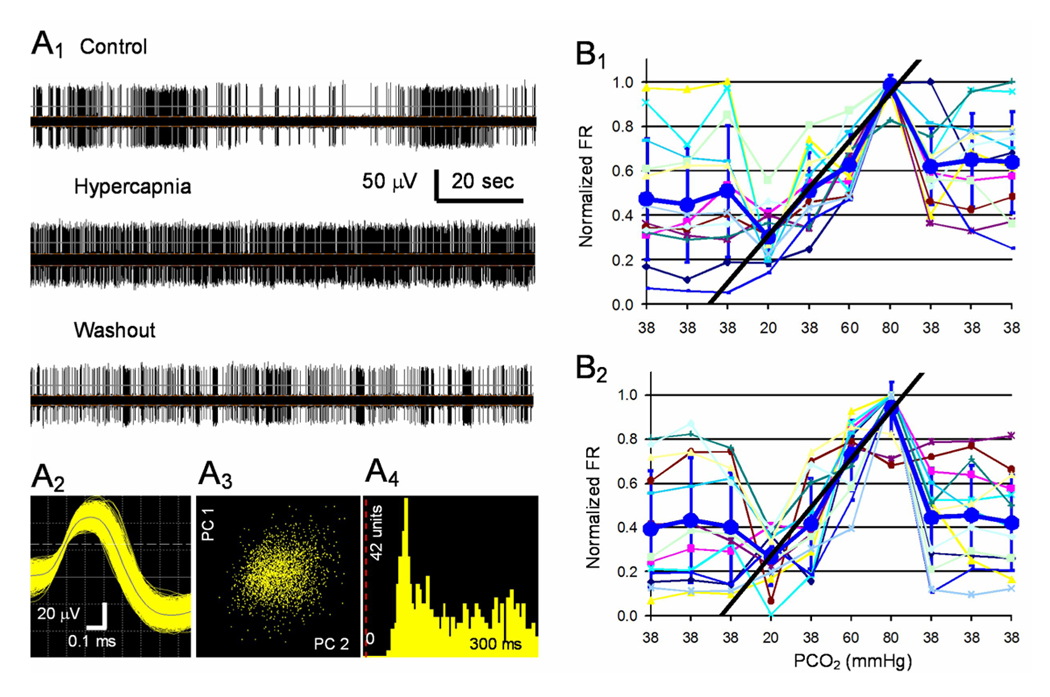
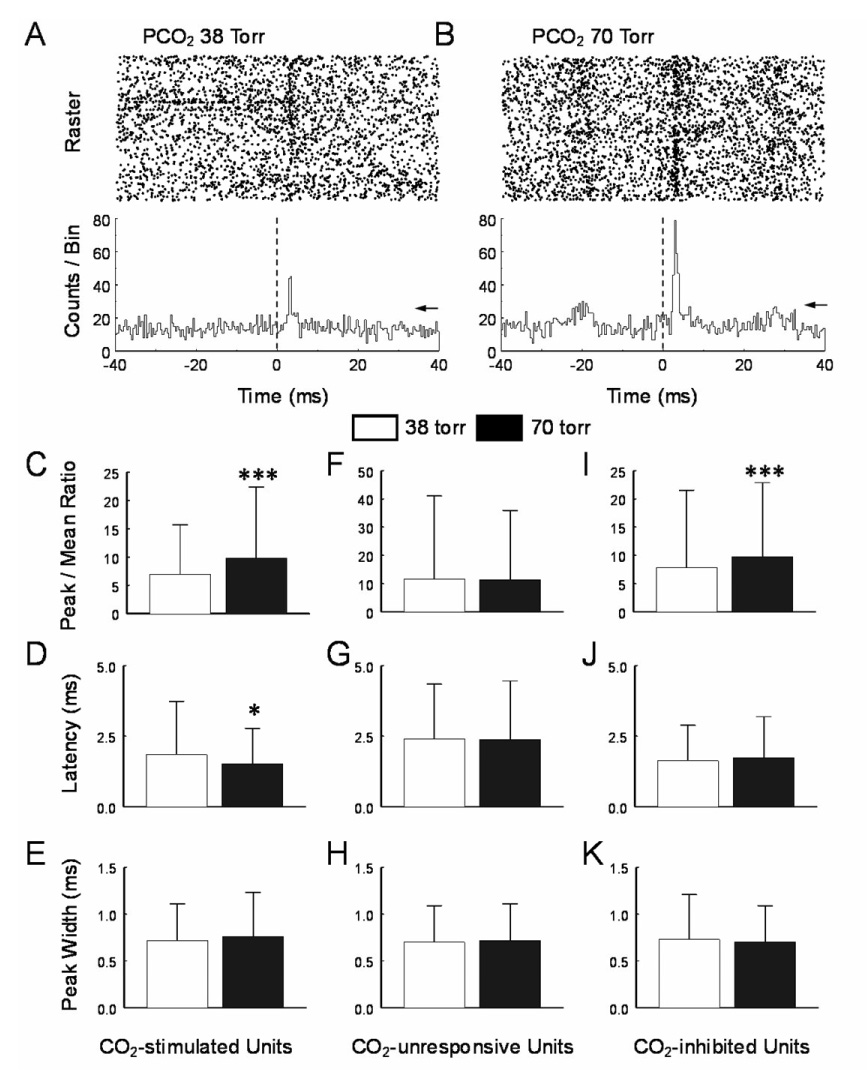
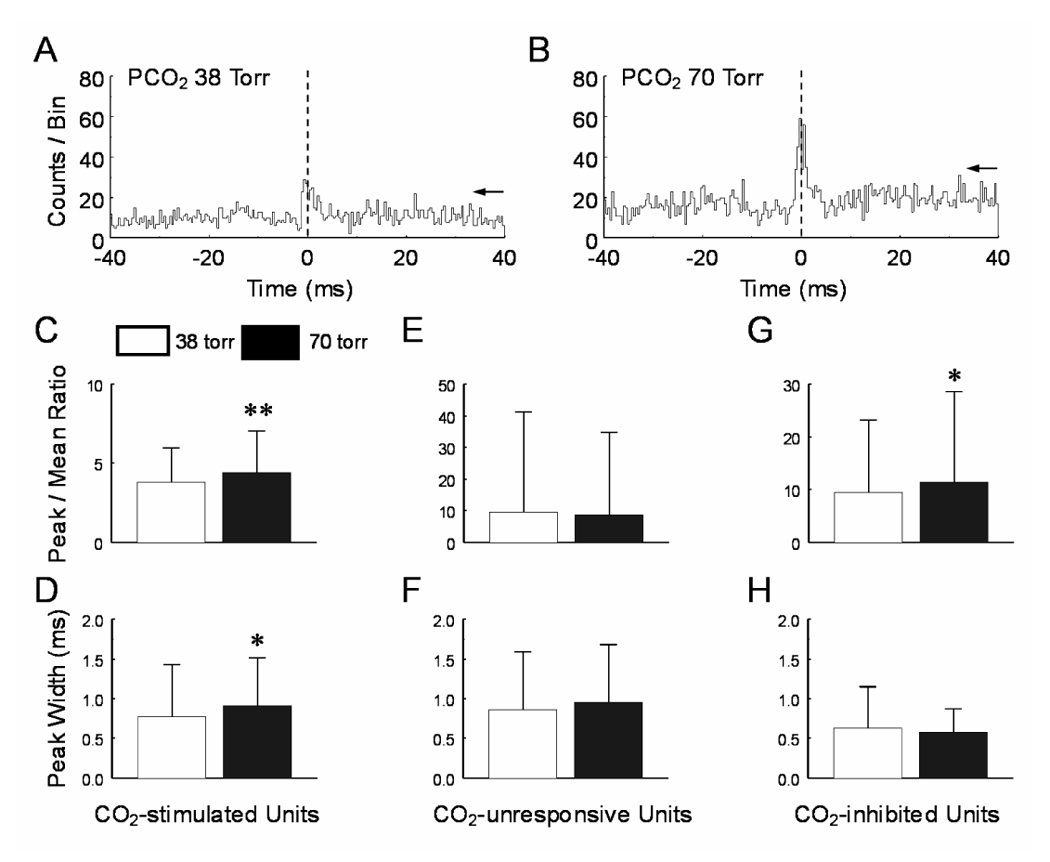
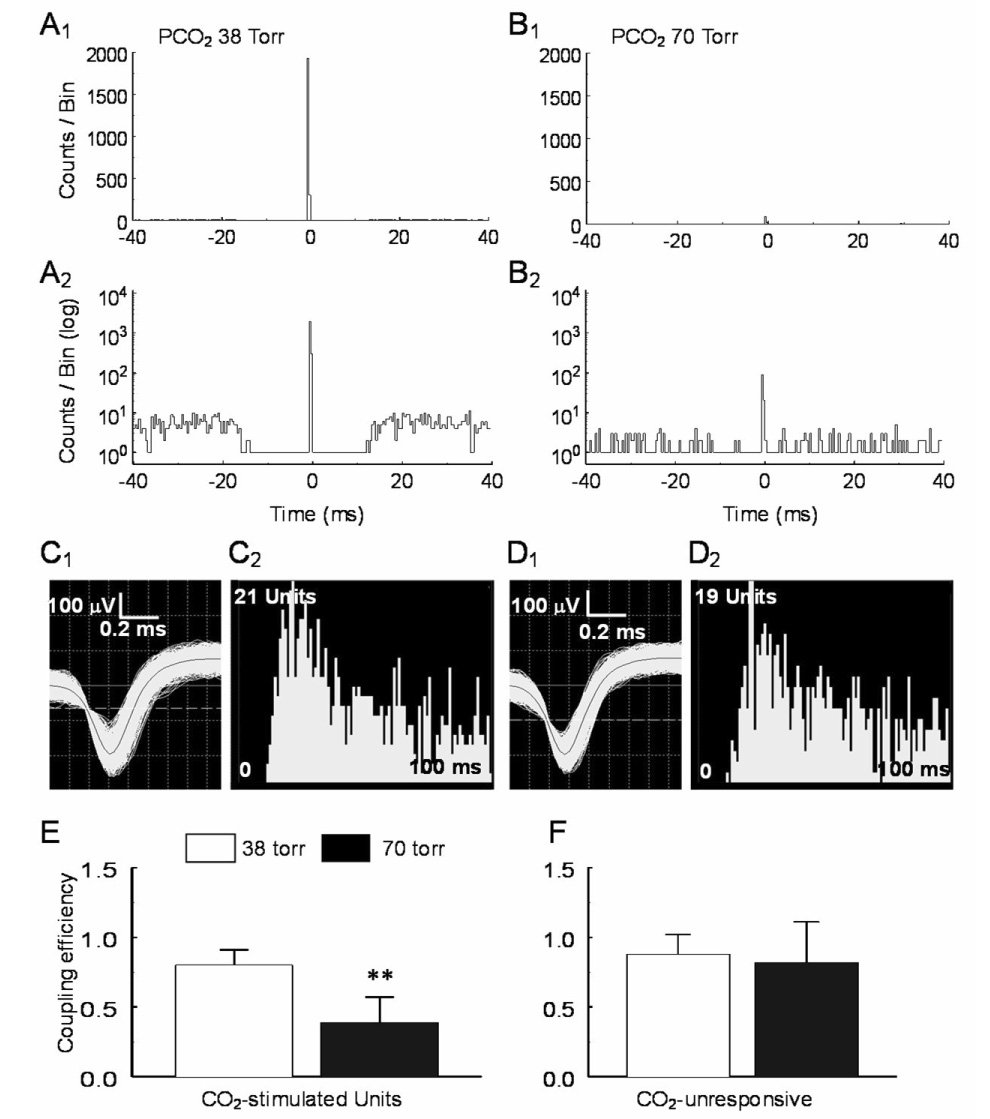
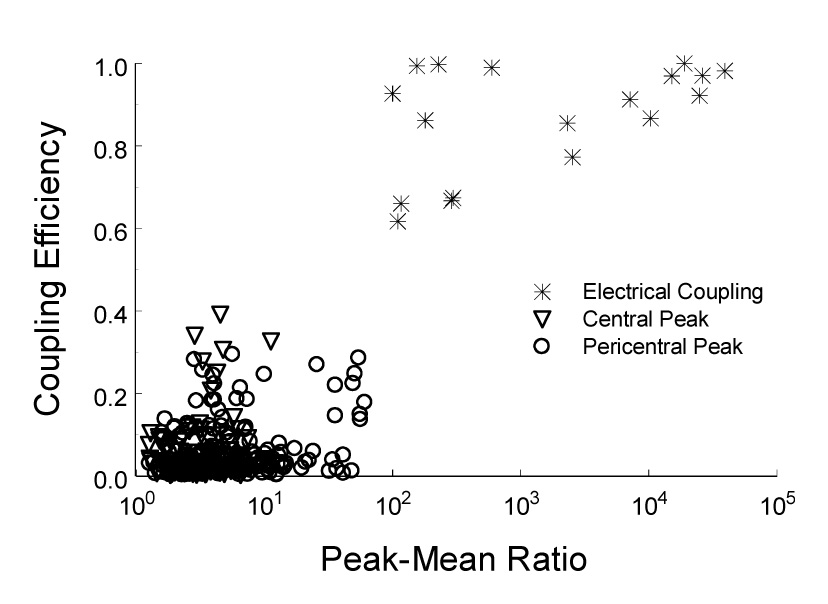
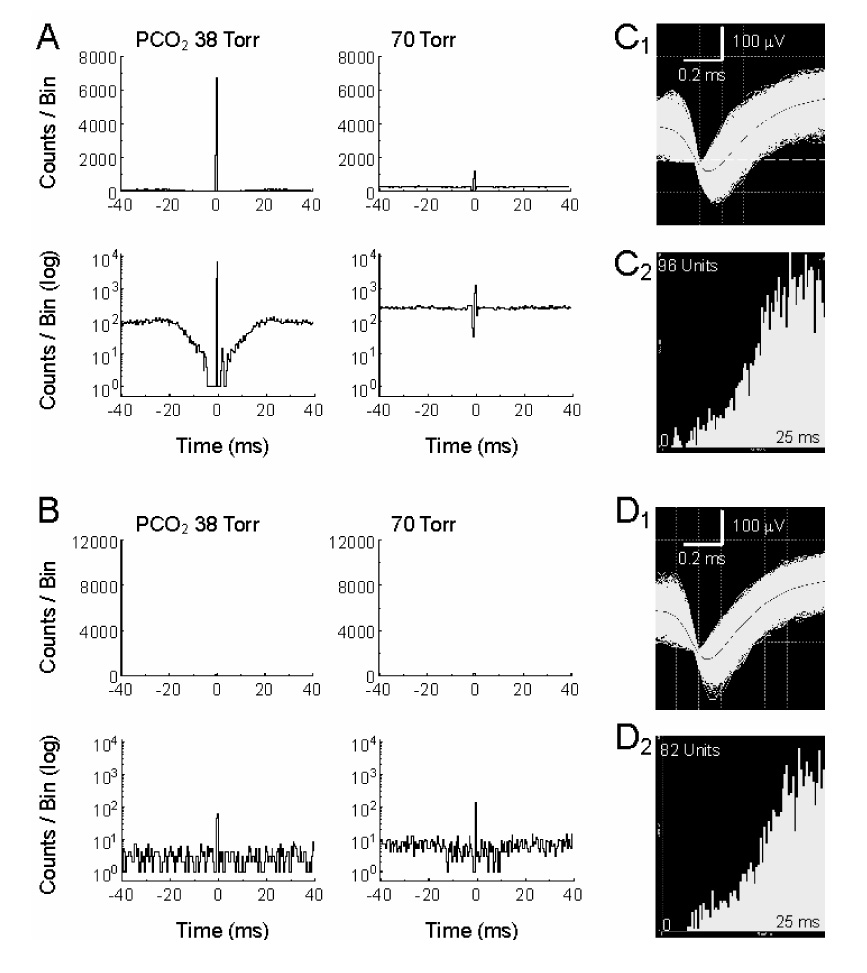
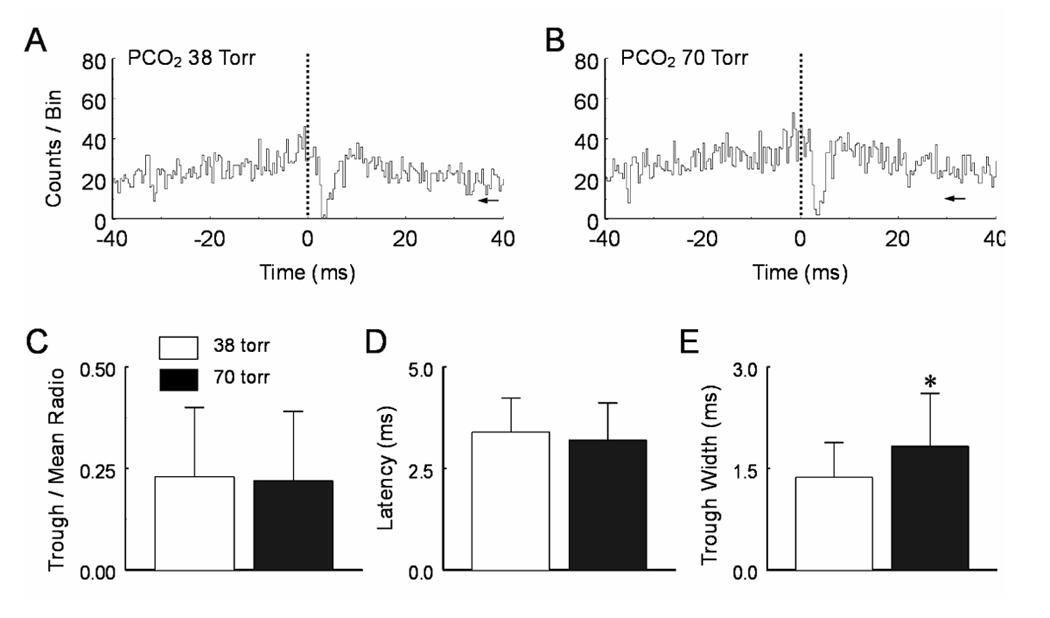
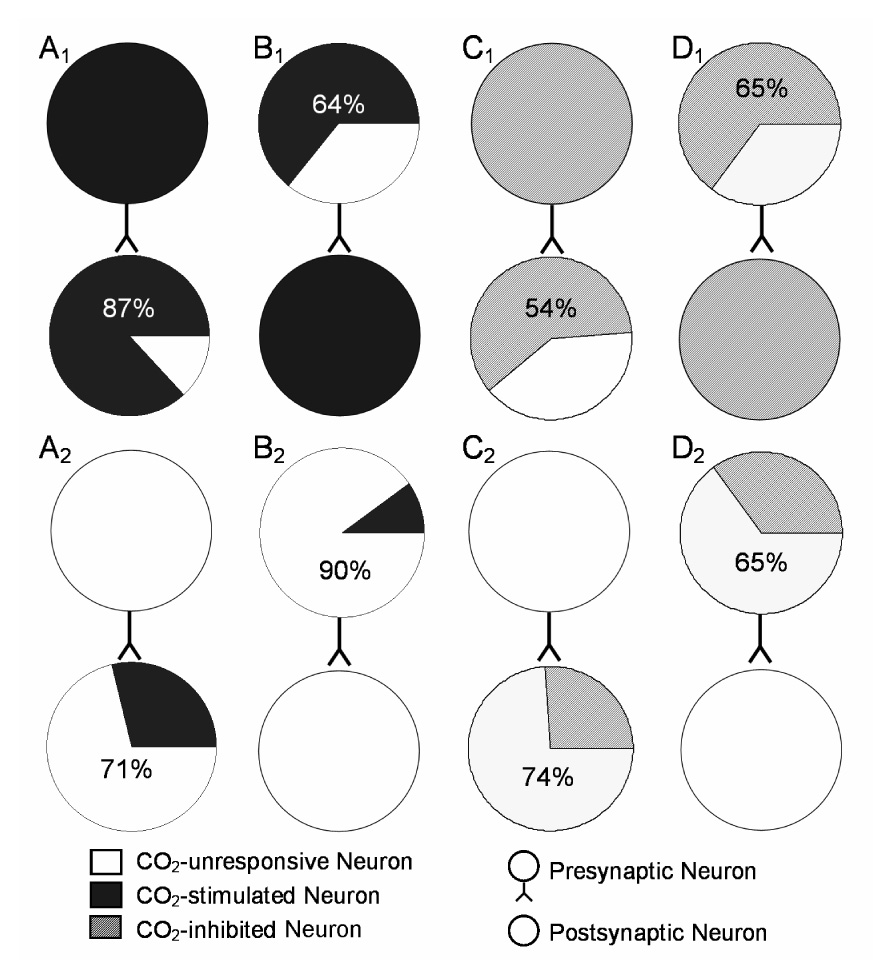
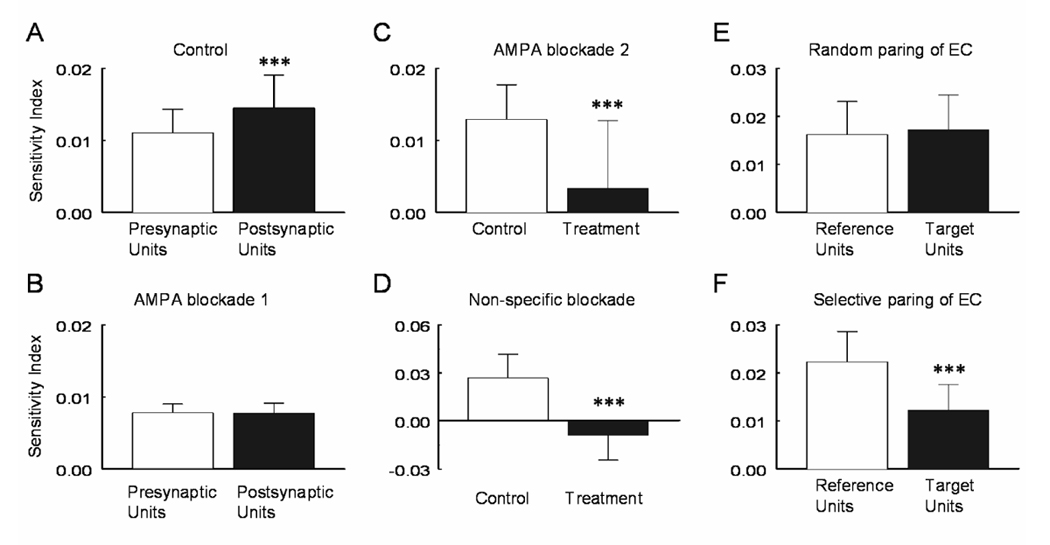
CO(2) is an important metabolic product whose concentrations are constantly monitored by CO(2) chemoreceptors. However, the high systemic CO(2) sensitivity may not be achieved by the CO(2) chemoreceptors without neuronal network processes. To show modulation of network properties during hypercapnia, we studied brainstem neurons dissociated from embryonic rats (P17-19) in multielectrode arrays (MEA) after initial period (3 weeks) of culture. Spike trains of 33,622 pairs of units were analyzed using peri-event histograms (PEH). The amplitude of peri-central peaks between two CO(2)-stimulated units increased and the peak latency decreased during hypercapnia. Similar enhancement of synaptic strength was observed in those sharing a common input. These phenomena were not seen in CO(2)-unresponsive neurons. The amplitude of peri-central peaks between two CO(2) inhibited units also increased without changing latency. Over 60% CO(2)-stimulated neurons studied received mono-/oligosynaptic inputs from other CO(2)-stimulated cells, whereas only approximately 10% CO(2)-unresponsive neurons had such synaptic inputs. A small number of brainstem neurons showed electrical couplings. The coupling efficiency of CO(2)-stimulated but not CO(2)-unresponsive units was suppressed by approximately 50% with high PCO(2). Inhibitory synaptic projections were also found, which was barely affected by hypercapnia. Consistent with the strengthening of excitatory synaptic connections, CO(2) sensitivity of post-synaptic neurons was significantly higher than presynaptic neurons. The difference was eliminated with blockade of presynaptic input. Based on these indirect assessments of synaptic interaction, our PEH analysis suggests that hypercapnia appears to modulate excitatory synaptic transmissions, especially those between CO(2)-stimulated neurons.


Figures

Fig. 1
Fig. 1
CO2 chemosensitivity of single unit recorded in the MEA. A1. A single unit was recorded from one channel of an MEA dish (upper). The unit was stimulated reversibly with an exposure to 10% CO2 (middle), and its firing activity returned to the baseline level after washout (lower). A2. The digitized action potentials show a duration >1ms. Note that the longer negative wave was not shown. A3. The PCA shows that all spikes detected are clustered in the X-Y axis system, where the X axis is PC2 (i.e., the waveform projection onto the first principal component) and Y axis is PC1 (i.e., the waveform projection onto the 2nd principal component). A4. The interspike histogram indicates single-unit recording because of the lack of action potentials in the initial 20ms. B1. Thirteen units were recorded in another MEA dish. The firing rate (FR) of these units was modulated by CO2 in a concentration-dependent manner. A linear response in the FR was seen in PCO2 20 – 80 torr. Note that each symbol indicates a unit, and the average of all units is shown as large circles and thicker line (means ± S.D.). The FR response can be described with a linear equation as shown with the straight line, and the slope value or the C value is 0.011. B2. The response was reproducible as seen with repetitive exposure in a 24-hr interval with the C value 0.011.
Fig. 2
Fig. 2
The peri-central peak. A. A peri-event histogram (PEH) was built between two CO2-stimulated units. In the raster display (upper), action potentials of the target unit show a higher occurrence about 2 ms after spiking of the reference unit at baseline PCO2 (38 torr). Average of the spikes of the target unit shows a clear pericentral peak in the PEH (lower). The peak is significantly greater than the 99.9% confidence level (arrow). B. During hypercapnic exposure (PCO2 70 torr), the peak increased markedly, while the background counts also rose to a less degree. In CO2-stimulated units, the average peak-mean ratio was significantly higher during hypercapnia than in baseline (C), the peak latency was reduced (D), and the peak width did not show significant changes (E). Similar analysis was done in CO2-unresponsive units, but none of the peak-mean ratio (F), peak latency (G), and peak width (H) changed significantly. I–K, In CO2 inhibited units, only the peak-mean ration increased significantly. *, P<0.05, **; P<0.01; ***, P<0.001. Data are represented as mean ± S.D.
Fig. 3
Fig. 3
The central peak. A, B. Peri-event histograms showed that the amplitude of the central peak between two CO2-stimulated units was higher during hypercapnia. C, D. Significant increases of the peak-mean ratio and peak width were observed in CO2-stimulated units. Hypercapnia did not alter these values in CO2-unresponsive (E, F) and CO2-inhibited units (G, H). *, P<0.05; **, P<0.01. Data are represented as mean ± S.D.
Fig. 4
Fig. 4
Suppression of electrical coupling during hypercapnia. A. A sharp central peak was seen in a pair of CO2-stimulated units. The spike trains of these units occurred almost always simultaneously with the background counts barely seen in regular scale (A1). Seen in log scale (A2), the background counts were not symmetric (coupling efficiency = 0.99). B1, B2. The coupling between these units was greatly diminished during high CO2 exposure (coupling efficiency = 0.10). C, D. The spike morphology and interspike histograms show single unit recordings with action potential duration > 1ms (C1, D1) for both units. E, F. Statistical analysis show that the electrical coupling is suppressed in CO2-stimulated units (P=0.006, n=4) but not in CO2-unresponsive units (P=0.21, n=12). Data are represented as mean ± S.D.
Fig. 5
Fig. 5
Plot of central peak and electrical coupling using coupling efficiency vs. peak-mean ratio. The pericentral peak and central peak go into one cluster whereas electrical coupling forms another clear cluster.
Fig. 6
Fig. 6
Sensitivity of the electrical coupling to halothane. A. Electrical coupling was seen in a pair of CO2-stimulated units (coupling efficiency = 0.91). The electrical coupling was strongly and reversibly inhibited with hypercapnia (coupling efficiency = 0.17). B. The electrical coupling was also strongly inhibited by 2mM halothane (coupling efficiency = 0.18). In the presence of halothane, hypercapnia failed to inhibit the electrical coupling (coupling efficiency = 0.21). C, D. Action potential morphology and interspike internal analyses indicate that these units are single and recorded from soma.
Fig. 7
Fig. 7
Hypercapnic effects on pericentral troughs. A. A narrow pericentral trough was seen in the PEH with the reference unit CO2-stimulated and target unit CO2-inhibited. B. Hypercapnia had very little effect on the pericentral trough. C, D. Statistical analysis indicates that none of the trough/mean ratio and trough latency is affected by hypercapnia. E. The trough width at half magnitude is enhanced at PCO2 70 torr (P<0.05, n=5). Data are represented as mean ± S.D.
Fig. 8
Fig. 8
Connection preference of cultured brainstem neurons. A. Concerning reference units, 87% CO2-stimulated units projected to another CO2-stimulated units (A1), while only 29% CO2-unresponsive units projected to CO2-stimulated units (A2). B. With respect to target units, 64% CO2-stimulated units received synaptic input from another CO2-stimulated units (B1). Only 10% CO2-unresponsive received such synaptic input (B2). C. For the reference units, 54% CO2-inhibited neurons projected to another CO2-inhibited units (C1), whereas only 26% CO2-unresponsive units projected to the CO2-inhibited units (C2). D. From the target units, 65% CO2-inhibited neuron received synaptic input from another CO2-inhibited units (D1), but only 46% CO2-unresponsive units received synaptic inputs from another CO2-inhibited units (D2).
Fig. 9
Fig. 9
Enhancement of CO2 sensitivity by synapse transmission. A. With intact synaptic transmission, the post-synaptic neurons had a C value significantly higher than the presynaptic units (P=9.0E-06, n=61). B. Such a difference was abolished by a blockade of excitatory synaptic transmission with 10µM CNQX (P=0.45, n=13). C. In the presence of 10µM CNQX, some units lost the CO2 chemosensitivity almost completely (P=7.0E-05, n=20). D. Similar effect was seen with a non-specific blockade of synaptic transmission using low Ca2+ (<1 µM) and high concentrations of Mg2+ (2 mM) (P=3.3E-06, n=13). E. Both reference and target units showed identical CO2 sensitivity when they were grouped randomly (P=0.45, n=4). F. However, one of the units in each pair showed much higher CO2 sensitivity than the other when they were pooled together (P=0.0004, n=4). Data are represented as mean ± S.D.

Similar articles

Cited by

References

    1. Aertsen AM, Gerstein GL, Habib MK, Palm G. Dynamics of neuronal firing correlation: modulation of "effective connectivity". J Neurophysiol. 1989;61:917. - PubMed
    1. Bou-Flores C, Berger AJ. Gap junctions and inhibitory synapses modulate inspiratory motoneuron synchronization. J Neurophysiol. 2001;85:1543–1551. - PubMed
    1. Buzsaki G. Large-scale recording of neuronal ensembles. Nat.Neurosci. 2004;7:446–451. - PubMed
    1. Chen G, Dunbar RL, Gao W, Ebner TJ. Role of calcium, glutamate neurotransmission, and nitric oxide in spreading acidification and depression in the cerebellar cortex. J Neurosci. 2001;21:9877–9887. - PMC - PubMed
    1. Christie JM, Bark C, Hormuzdi SG, Helbig I, Monyer H, Westbrook GL. Connexin36 mediates spike synchrony in olfactory bulb glomeruli. Neuron. 2005;46:761–772. - PubMed

Publication types