Comparative Study
. 2008 Apr;63(4):335-41.
doi: 10.1136/thx.2007.084731. Epub 2007 Oct 26.

Validation of two models to estimate the probability of malignancy in patients with solitary pulmonary nodules

Affiliations
Comparative Study

Validation of two models to estimate the probability of malignancy in patients with solitary pulmonary nodules

E M Schultz et al. Thorax. 2008 Apr.

Abstract

Background: Effective strategies for managing patients with solitary pulmonary nodules (SPN) depend critically on the pre-test probability of malignancy.

Objective: To validate two previously developed models that estimate the probability that an indeterminate SPN is malignant, based on clinical characteristics and radiographic findings.

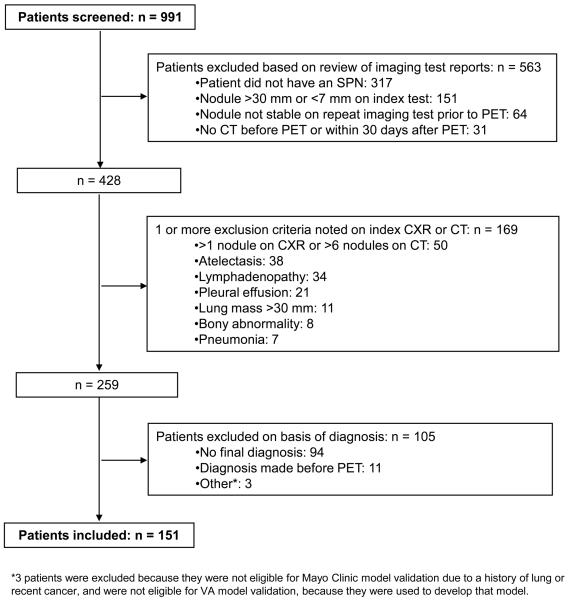
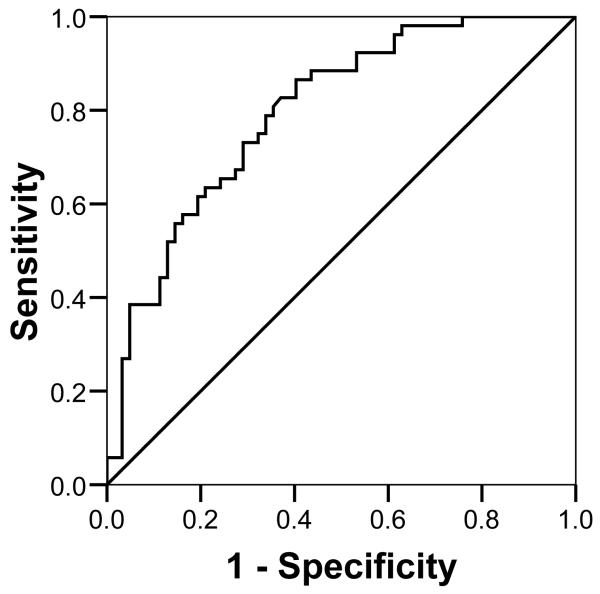
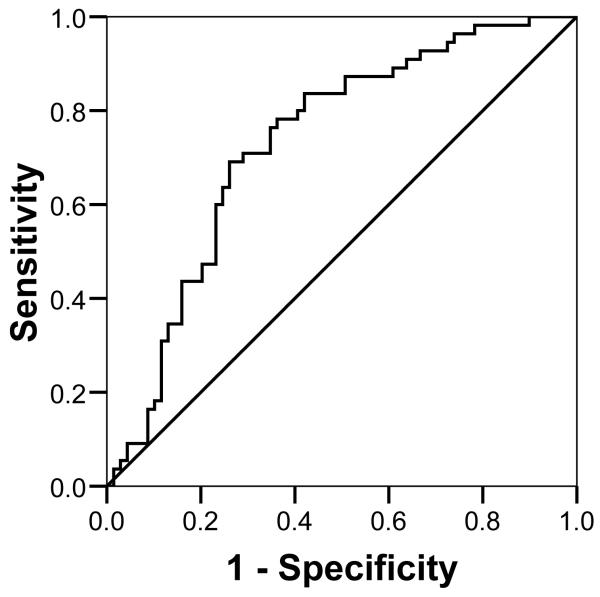
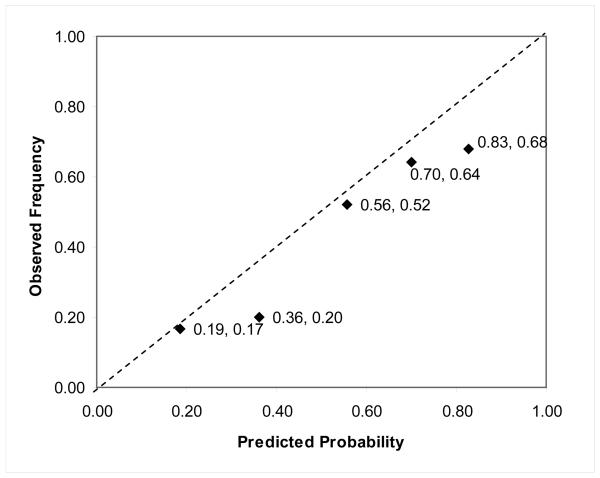
Methods: Data on age, smoking and cancer history, nodule size, location and spiculation were collected retrospectively from the medical records of 151 veterans (145 men, 6 women; age range 39-87 years) with an SPN measuring 7-30 mm (inclusive) and a final diagnosis established by histopathology or 2-year follow-up. Each patient's final diagnosis was compared with the probability of malignancy predicted by two models: one developed by investigators at the Mayo Clinic and the other developed from patients enrolled in a VA Cooperative Study. The accuracy of each model was assessed by calculating areas under the receiver operating characteristic (ROC) curve and the models were calibrated by comparing predicted and observed rates of malignancy.

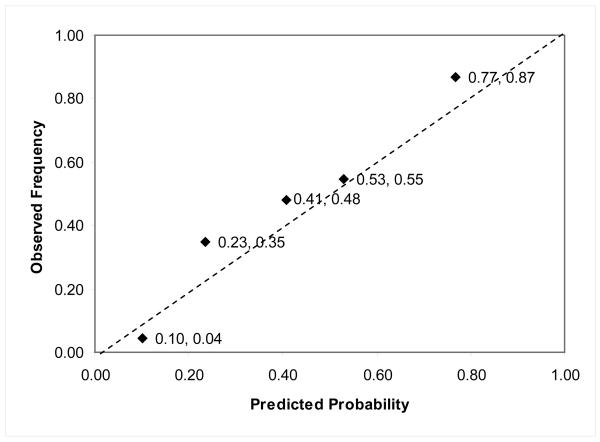
Results: The area under the ROC curve for the Mayo Clinic model (0.80; 95% CI 0.72 to 0.88) was higher than that of the VA model (0.73; 95% CI 0.64 to 0.82), but this difference was not statistically significant (Delta = 0.07; 95% CI -0.03 to 0.16). Calibration curves showed that the probability of malignancy was underestimated by the Mayo Clinic model and overestimated by the VA model.

Conclusions: Two existing prediction models are sufficiently accurate to guide decisions about the selection and interpretation of subsequent diagnostic tests in patients with SPNs, although clinicians should also consider the prevalence of malignancy in their practice setting when choosing a model.


Figures

Figure 1
Figure 1. Study Eligibility and Reasons for Patient Exclusions
Of the 991 patients screened for inclusion in this study, 840 were determined to be ineligible because they met one or more of the exclusion criteria. For those patients who met multiple exclusion criteria, only the first reason for exclusion is presented in this figure. SPN = solitary pulmonary nodule; PET = positron emission tomography; CT = computed tomography; CXR = chest x-ray.
Figure 2
Figure 2. Receiver Operating Characteristic Curve (Panel A) and Calibration Curve (Panel B) for Validation of the Mayo Clinic Model
(A) AUC = 0.80 (95% CI 0.72-0.88). (B) The calibration curve plots the median predicted probability of a malignant SPN by the observed frequency of malignancy for patients in each quintile of predicted probability. The range of predicted probabilities for patients in the first, second, third, fourth and fifth quintiles were <0.15, 0.15 to 0.30, 0.31 to 0.46, 0.47 to 0.66 and >0.66, respectively. AUC = area under the receiver operating characteristic curve; CI = confidence interval; SPN = solitary pulmonary nodule
Figure 3
Figure 3. Receiver Operating Characteristic Curve (Panel A) and Calibration Curve (Panel B) for Validation of the VA Cooperative Study Model
(A) AUC = 0.73 (95% CI 0.64 -0.82). (B) The calibration curve plots the median predicted probability of a malignant SPN by the observed frequency of malignancy for patients in each quintile. The range of predicted probabilities for patients in the first, second, third, fourth and fifth quintiles were <0.26, 0.26 to 0.45, 0.46 to 0.65, 0.66 to 0.75 and >0.75, respectively. AUC = area under the receiver operating characteristic curve; CI = confidence interval; SPN = solitary pulmonary nodule

References

    1. Ost D, Fein AM, Feinsilver SH. Clinical practice. The solitary pulmonary nodule. N Engl J Med. 2003;348:2535–42. - PubMed
    1. Tan BB, Flaherty KR, Kazerooni EA, et al. The solitary pulmonary nodule. Chest. 2003;123:89S–96S. - PubMed
    1. Cummings SR, Lillington GA, Richard RJ. Managing solitary pulmonary nodules. The choice of strategy is a “close call”. Am Rev Respir Dis. 1986;134:453–60. - PubMed
    1. Dietlein M, Weber K, Gandjour A, et al. Cost-effectiveness of FDG-PET for the management of solitary pulmonary nodules: a decision analysis based on cost reimbursement in Germany. Eur J Nucl Med. 2000;27:1441–56. - PubMed
    1. Gambhir SS, Shepherd JE, Shah BD, et al. Analytical decision model for the cost-effective management of solitary pulmonary nodules. J Clin Oncol. 1998;16:2113–25. - PubMed

Publication types