. 2007 Dec;145(4):1714-25.
doi: 10.1104/pp.107.110262. Epub 2007 Oct 26.

Root plasma membrane transporters controlling K+/Na+ homeostasis in salt-stressed barley

Affiliations

Root plasma membrane transporters controlling K+/Na+ homeostasis in salt-stressed barley

Zhonghua Chen et al. Plant Physiol. 2007 Dec.

Abstract

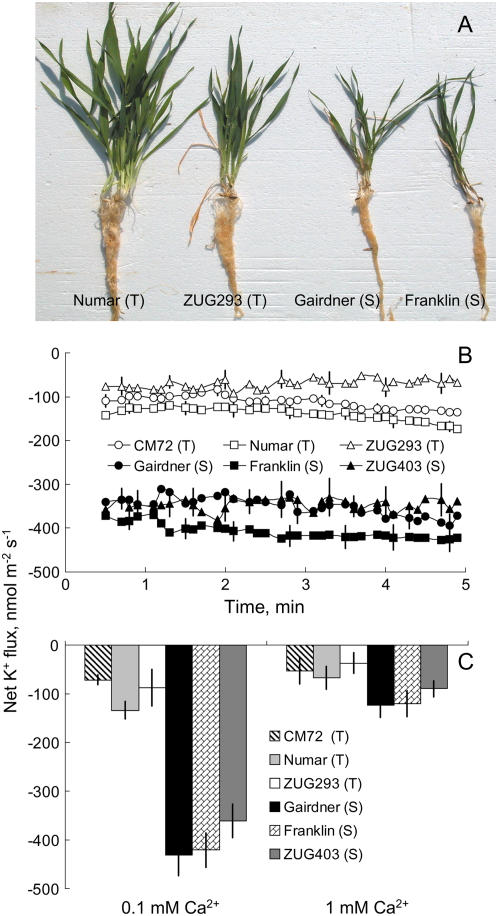
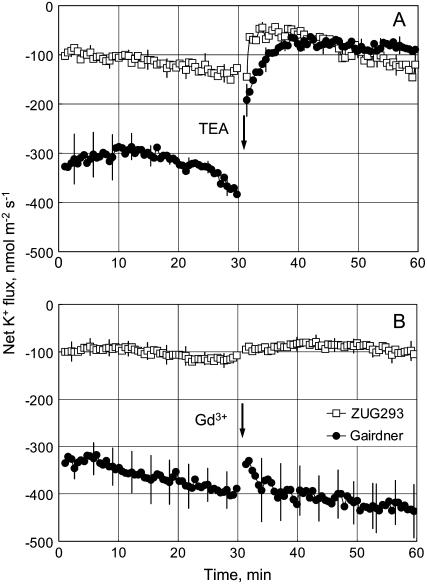
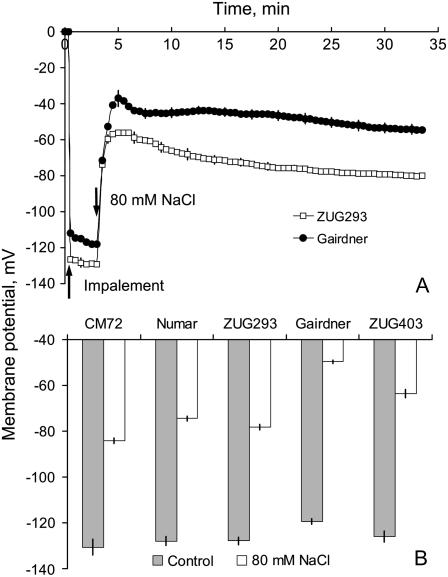
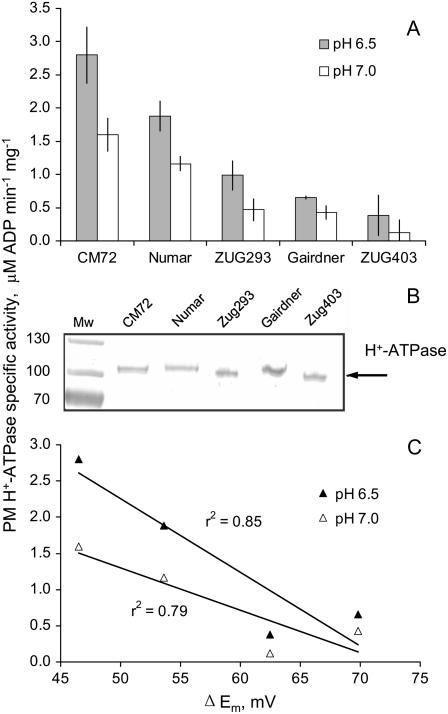
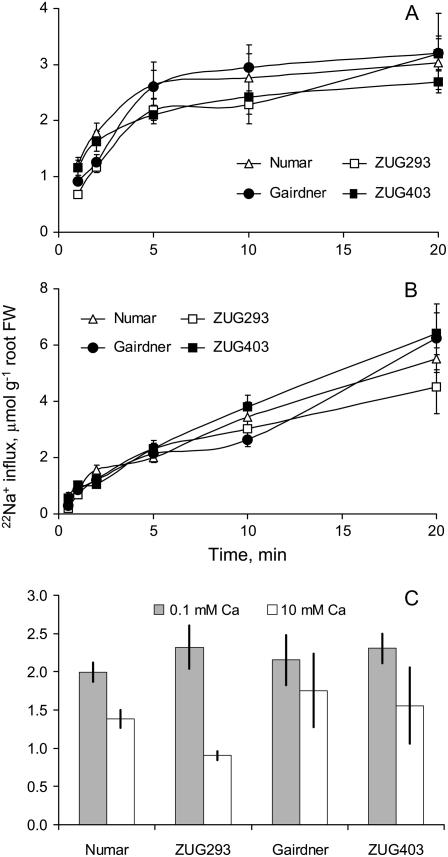
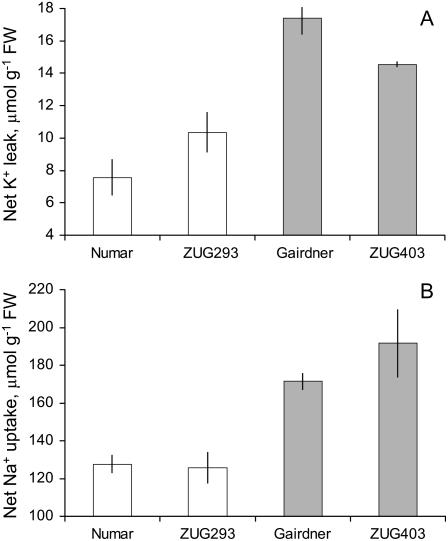
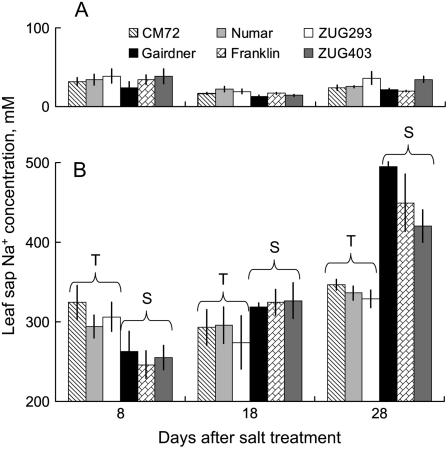
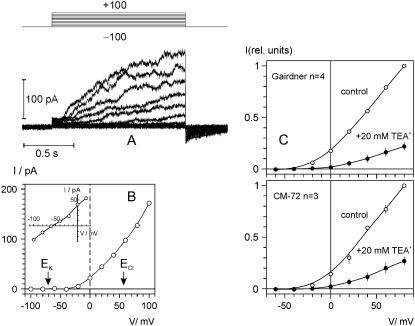
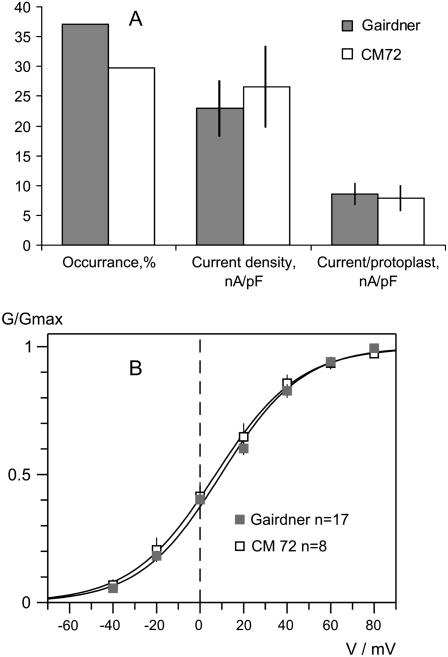
Plant salinity tolerance is a polygenic trait with contributions from genetic, developmental, and physiological interactions, in addition to interactions between the plant and its environment. In this study, we show that in salt-tolerant genotypes of barley (Hordeum vulgare), multiple mechanisms are well combined to withstand saline conditions. These mechanisms include: (1) better control of membrane voltage so retaining a more negative membrane potential; (2) intrinsically higher H(+) pump activity; (3) better ability of root cells to pump Na(+) from the cytosol to the external medium; and (4) higher sensitivity to supplemental Ca(2+). At the same time, no significant difference was found between contrasting cultivars in their unidirectional (22)Na(+) influx or in the density and voltage dependence of depolarization-activated outward-rectifying K(+) channels. Overall, our results are consistent with the idea of the cytosolic K(+)-to-Na(+) ratio being a key determinant of plant salinity tolerance, and suggest multiple pathways of controlling that important feature in salt-tolerant plants.


Figures

Figure 1.
Figure 1.
A, Contrasting barley genotypes grown under 320 mm NaCl for 4 weeks in the glasshouse experiment. Salt-tolerant (T) and salt-sensitive (S) varieties are easily distinguished. B, Steady-state net K+ fluxes (inward positive). C, Effects of different external Ca2+ (0.1 and 1 mm) on NaCl-induced K+ flux measured from 3-d-old roots of barley genotypes contrasting in their salinity tolerance after 1 h of 80 mm NaCl treatment. Results in C are averaged over 15 min of K+ flux measurement. Means ± se (n = 7–10). [See online article for color version of this figure.]
Figure 2.
Figure 2.
Pharmacology of K+ flux responses. Net K+ fluxes were measured in response to 20 mm TEA+, applied at arrow, from roots of two contrasting barley genotypes (salt-tolerant ‘ZUG293’; salt-sensitive ‘Gairdner’) preincubated in 80 mm NaCl for 1 h. Means ± se (n = 7–8).
Figure 3.
Figure 3.
A, Membrane potential of epidermal root cells of salt-tolerant ‘ZUG293’ and salt-sensitive ‘Gairdner’ measured in response to 80 mm NaCl treatment (at arrow). Means ± se (n = 6). B, Steady-state membrane potential (Em) values in control (prior to NaCl treatment) and after 20 min root exposure to 80 mm NaCl. Means ± se (n = 10).
Figure 4.
Figure 4.
A, ATP hydrolytic activity of PMs isolated from the microsomal fraction of roots of barley genotypes contrasting in salinity tolerance. Means ± se (n = 6). The statistics are based on two independent PM preparations and each of the preparations was tested three times with reproducible results. B, Western-blot results demonstrating that the observed difference in the H+-ATPase activity is not due to a difference in the enzyme level.
Figure 5.
Figure 5.
Unidirectional 22Na+ uptake, at times up to 20 min, into excised roots of four barley cultivars contrasting in their salinity tolerance. A, Immediately after 80 mm NaCl treatment. B, After 24 h incubation in 80 mm NaCl. C, For the immediate treatment, the 22Na+ uptake during 5 min with two levels of external Ca2+ (0.1 as in A and 10 mm in C). Means ± se (n = 8–13).
Figure 6.
Figure 6.
K+ loss (A) and Na+ uptake (B) by barley roots measured in depletion experiments. In each treatment, roots of ten 3-d-old seedlings were immersed in 10 mL saline solution (80 mm NaCl, 0.5 mm KCl, 0.1 mm CaCl2) in a plastic test tube and aerated for 24 h in the dark at 25°C. Two individual measurements were performed with three replicates for each genotype. Means ± se (n = 6).
Figure 7.
Figure 7.
Leaf sap Na+ concentrations of six barley genotypes in both control (A) and 320 mm NaCl treatment (B). Flag leaf samples of all cultivars were collected 8, 18, and 28 d after the imposition of salinity. Means ± se (n = 4).
Figure 8.
Figure 8.
Time- and voltage-dependent TEA-sensitive KOR currents in barley epidermal protoplasts. K+ concentration in bath/pipette was 5/100 mm (see “Materials and Methods” for detailed solution composition). A, Typical record of KOR currents in salt-sensitive ‘Gairdner’. Voltage was stepped from −100 mV (holding) in 20 mV increments up to +100 mV for 1.4 s and returned to −100 mV at the end of episode. B, I/V relation for the time-dependent component of the depolarization activated current; equilibrium potentials for K+ and Cl are indicated by arrows. Inset shows amplitude of the tail currents (prepulse to +80 mV, subsequent test pulses to voltages between −100 and +20 mV) as a function of test voltage. C, KOR currents in two contrasting barley cultivars (salt-tolerant ‘CM72’ and salt-sensitive ‘Gairdner’) show similar sensitivity to external TEA+. Shown are normalized I/V relations of the time-dependent current component in control conditions and after external application of 20 mm TEACl. Means ± se (n = 3 and 4 protoplasts for ‘CM72’ and ‘Gairdner’, respectively). Note that in some cases error bar is smaller than the symbol size.
Figure 9.
Figure 9.
Comparison of KOR-mediated currents in two contrasting barley cultivars: salt-tolerant ‘CM72’ and salt-sensitive ‘Gairdner’. A, Frequency of detection (successful/total records) of KOR channels, average current densities at +60 mV, and average KOR current per protoplast. Means ± se (n = 36 for ‘CM72’; 70 for ‘Gairdner’). B, Voltage dependence of KOR-mediated conductance. Solid lines are best fits to Boltzmann equation, with midpoint potential values of 6.4 ± 1.4 mV and 9.6 ± 2.4 mV, and the slope factor (membrane depolarization that increases open/closed states ratio e times) of 18.6 ± 0.8 mV and 18.8 ± 1.2 mV for ‘CM72’ and ‘Gairdner’, respectively.

References

    1. Apse MP, Aharon GS, Sneddon WA, Blumwald E (1999) Salt tolerance conferred by overexpression of a vacuolar Na+/H+ antiport in Arabidopsis. Science 285 1256–1258 - PubMed
    1. Berthomieu P, Conéjéro G, Nublat A, Brackenbury WJ, Lambert C, Savio C, Uozumi N, Oiki S, Yamada K, Cellier F, et al (2003) Functional analysis of AtHKT1 in Arabidopsis shows that Na+ recirculation by the phloem is crucial for salt tolerance. EMBO J 22 2004–2014 - PMC - PubMed
    1. Blumwald E (2000) Sodium transport and salt tolerance in plants. Curr Opin Cell Biol 12 431–434 - PubMed
    1. Blumwald E, Aharon GS, Apse MP (2000) Sodium transport in plant cells. Biochim Biophys Acta 1465 140–151 - PubMed
    1. Bordas M, Montesinos C, Dabauza M, Salvador A, Roig LA, Serrano R, Moreno V (1997) Transfer of the yeast salt tolerance gene HAL1 to Cucumis melo L. cultivars and in vitro evaluation of salt tolerance. Transgenic Res 5 1–10 - PubMed

Publication types

MeSH terms