. 2007 Oct;19(10):3058-79.
doi: 10.1105/tpc.107.051524. Epub 2007 Oct 26.

The GID1-mediated gibberellin perception mechanism is conserved in the Lycophyte Selaginella moellendorffii but not in the Bryophyte Physcomitrella patens

Affiliations

The GID1-mediated gibberellin perception mechanism is conserved in the Lycophyte Selaginella moellendorffii but not in the Bryophyte Physcomitrella patens

Ko Hirano et al. Plant Cell. 2007 Oct.

Abstract

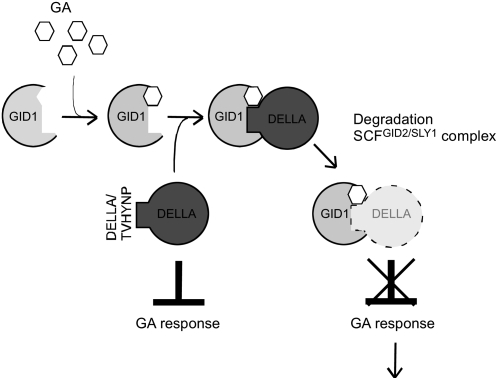
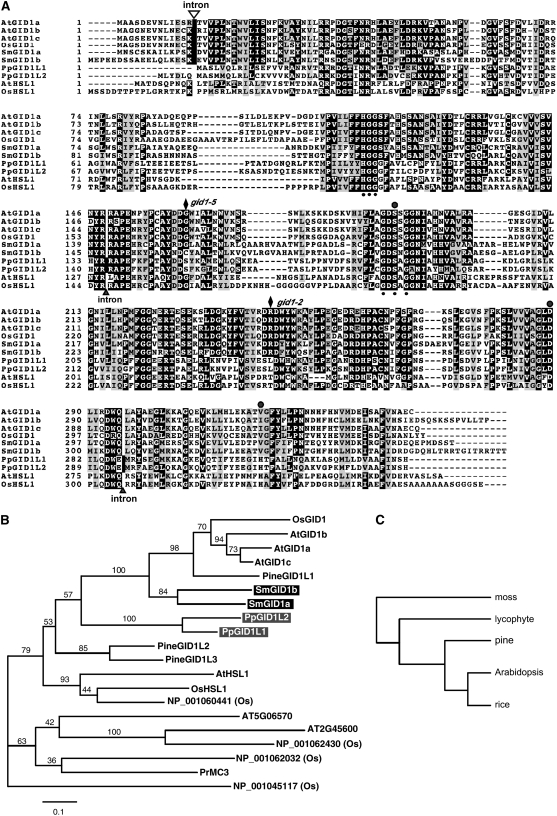
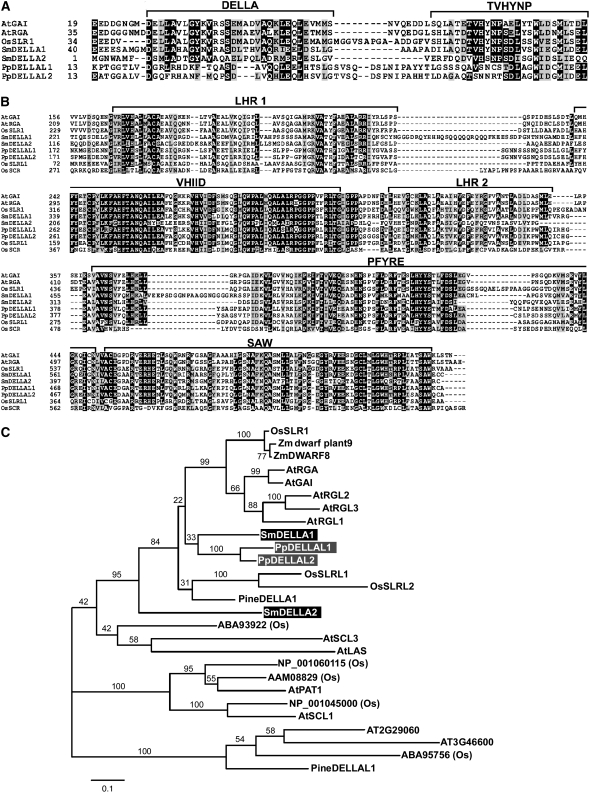
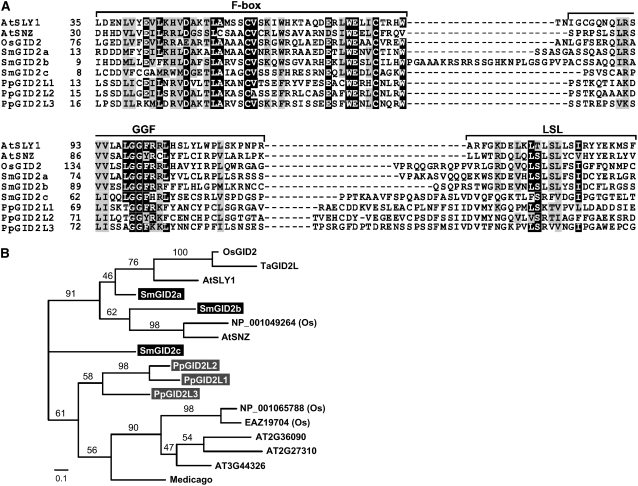
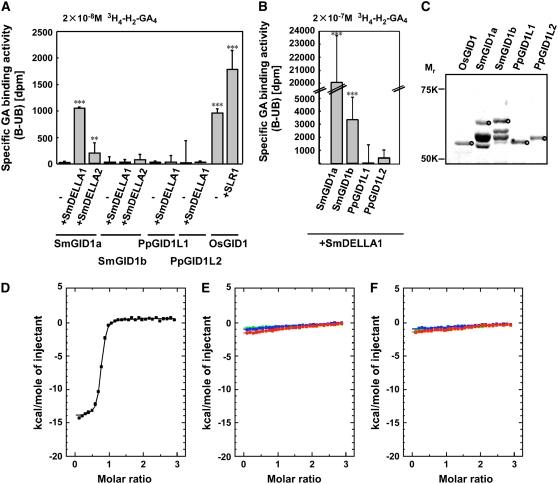
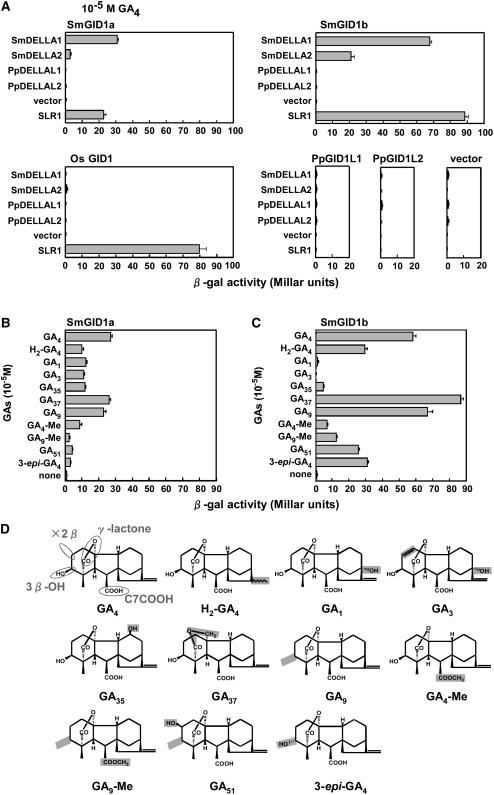
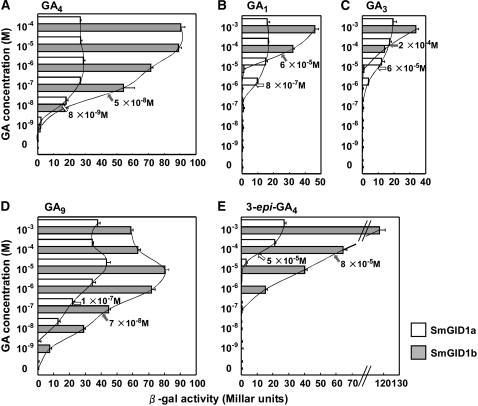
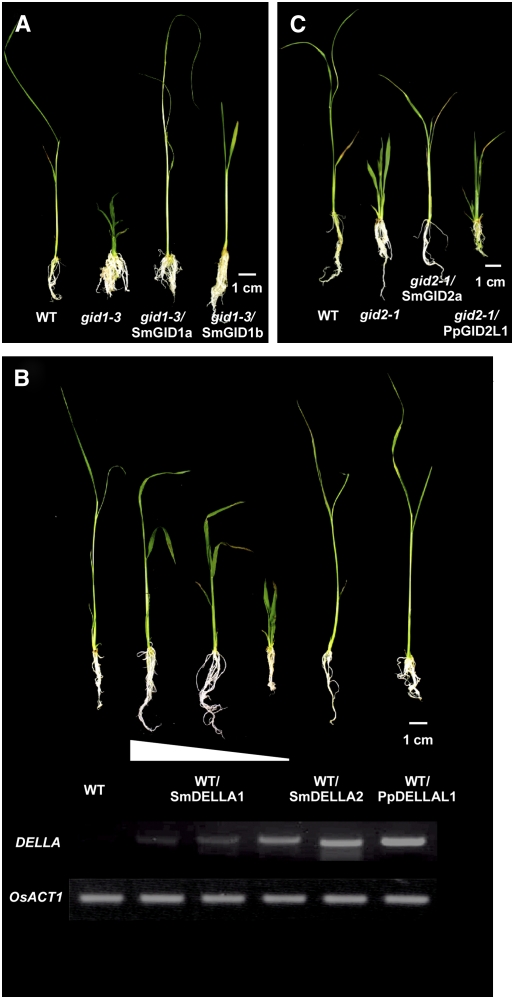
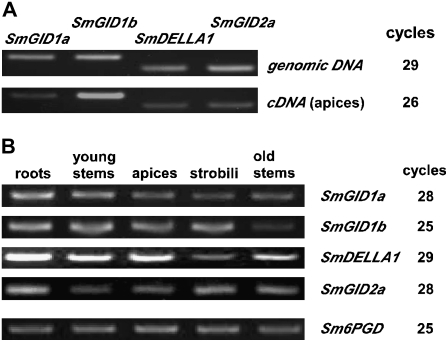
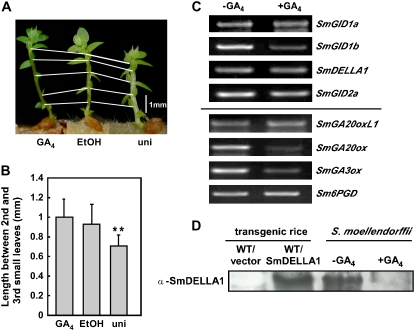
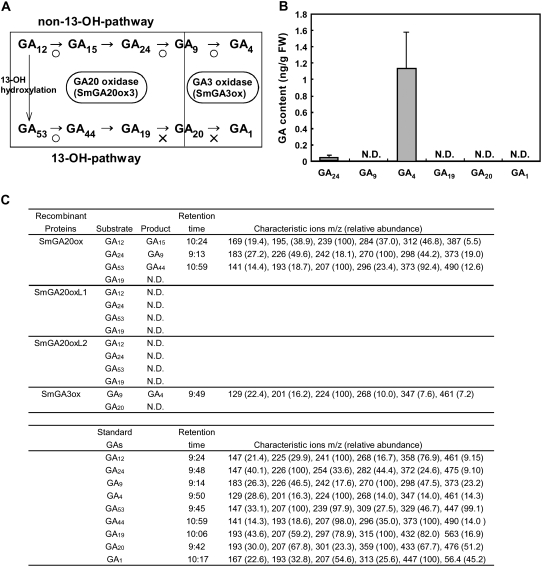
In rice (Oryza sativa) and Arabidopsis thaliana, gibberellin (GA) signaling is mediated by GIBBERELLIN-INSENSITIVE DWARF1 (GID1) and DELLA proteins in collaboration with a GA-specific F-box protein. To explore when plants evolved the ability to perceive GA by the GID1/DELLA pathway, we examined these GA signaling components in the lycophyte Selaginella moellendorffii and the bryophyte Physcomitrella patens. An in silico search identified several homologs of GID1, DELLA, and GID2, a GA-specific F-box protein in rice, in both species. Sm GID1a and Sm GID1b, GID1 proteins from S. moellendorffii, showed GA binding activity in vitro and interacted with DELLA proteins from S. moellendorffii in a GA-dependent manner in yeast. Introduction of constitutively expressed Sm GID1a, Sm G1D1b, and Sm GID2a transgenes rescued the dwarf phenotype of rice gid1 and gid2 mutants. Furthermore, treatment with GA(4), a major GA in S. moellendorffii, caused downregulation of Sm GID1b, Sm GA20 oxidase, and Sm GA3 oxidase and degradation of the Sm DELLA1 protein. These results demonstrate that the homologs of GID1, DELLA, and GID2 work in a similar manner in S. moellendorffii and in flowering plants. Biochemical studies revealed that Sm GID1s have different GA binding properties from GID1s in flowering plants. No evidence was found for the functional conservation of these genes in P. patens, indicating that GID1/DELLA-mediated GA signaling, if present, differs from that in vascular plants. Our results suggest that GID1/DELLA-mediated GA signaling appeared after the divergence of vascular plants from the moss lineage.


Figures

Figure 1.
Figure 1.
Current Model of GID1-Mediated GA Signaling in Flowering Plants. In the presence of GA, GID1 binds to DELLA, a negative regulator of GA action, to form the GA-GID1-DELLA complex. Subsequently, DELLA protein is degraded through the SCFGID2/SLY1 proteasome pathway, and as a consequence, GA actions occur.
Figure 2.
Figure 2.
Comparison of Deduced Amino Acid Sequences of GID1 Homologs in Land Plants. (A) Amino acid sequences of GID1-like proteins from Arabidopsis and rice (angiosperms), S. moellendorffii (lycophyte), and P. patens (bryophyte) were aligned with ClustalW (http://align.genome.jp/). The open triangle indicates the position of an intron shared by the true GID1 receptors (Os GID1 and At GID1s) and Sm GID1s. Closed triangles at the bottom of the alignment are intron positions unique to Pp GID1L proteins. Small and large circles represent the conserved residues and the catalytic triad in the HSL family, respectively. The positions of gid1-2 and gid1-5 mutations in rice mutants are indicated by black diamonds at the top of the alignment. The amino acid residues are numbered from the first Met, and gaps (dashes) were introduced to achieve maximum similarity. Black and gray boxes indicate identical and similar residues, respectively. At, Arabidopsis thaliana; Os, Oryza sativa; Pp, Physcomitrella patens; Sm, Selaginella moellendorffii. (B) Phylogenetic analysis of GID1 homologs. A maximum likelihood tree based on the JTT model (Jones et al., 1992) was obtained. The horizontal branch lengths are proportional to the estimated number of amino acid substitutions per residue. Bootstrap values were obtained by 1000 bootstrap replicates. Pr, Pinus radiata; Pine, Pinus taeda. (C) A consensus phylogenetic species relationship among moss, lycophyte, pine, Arabidopsis, and rice. Note that node lengths do not reflect the accurate divergence time of each species.
Figure 3.
Figure 3.
Comparison of Deduced Amino Acid Sequences of DELLA Homologs in Land Plants. (A) and (B) Amino acid sequence alignments of the N-terminal DELLA/TVHYNP domains (A) and C-terminal GRAS domains (B) of DELLA-like proteins from Arabidopsis and rice (angiosperms), S. moellendorffii (lycophyte), and P. patens (bryophyte) obtained using ClustalW (http://align.genome.jp/). The conserved regions or domains are presented at the top. The amino acid residues are numbered from the first Met, and gaps (dashes) were introduced to achieve higher similarity scores. Black and gray boxes indicate identical and similar residues, respectively. Abbreviations are as in Figure 1. (C) Phylogenetic analysis of DELLA protein homologs. A maximum likelihood tree based on the JTT model (Jones et al., 1992) was obtained. The horizontal branch lengths are proportional to the estimated number of amino acid substitutions per residue. Bootstrap values were obtained by 1000 bootstrap replicates. Zm, Zea mays.
Figure 4.
Figure 4.
Comparison of Deduced Amino Acid Sequences of GID2 Homologs in Land Plants. (A) Amino acid sequence alignment of GID2-like proteins from Arabidopsis and rice (angiosperms), S. moellendorffii (lycophyte), and P. patens (bryophyte) calculated using ClustalW (http://align.genome.jp/). The conserved regions or domains are presented at the top. The amino acid residues are numbered from the first Met, and gaps (dashes) were introduced to achieve maximum similarity. Black and gray boxes indicate identical and similar residues, respectively. Abbreviations are as in Figure 1. (B) Phylogenetic analysis of GID2 homologs. A maximum likelihood tree based on the amino acid alignment was obtained using the JTT model (Jones et al., 1992). The horizontal branch lengths are proportional to the estimated number of amino acid substitutions per residue. Bootstrap values were obtained by 1000 bootstrap replicates. Ta, Triticum aestivum.
Figure 5.
Figure 5.
GA Binding Properties of GID1 Homologs. (A) Affinity-purified Trx·His-Os GID1 or its homologs were incubated with 2 × 10⁻⁸ M 3H4-H2-GA4 in the presence or absence of GST-DELLA protein. The specific binding activity (B-UB) was calculated by subtracting the nonspecific binding activity (UB), which was evaluated by the addition of 0.125 mM GA4 to the assay solution, from the total binding activity (B). (B) GA binding activity of affinity-purified Trx·His-GID1 homologs under a higher concentration of 3H4-H2-GA4 (2 × 10⁻⁷ M). For (A) and (B), sd values were determined from more than three measurements. ** P < 0.01, *** P < 0.001 against vector control (data not shown), determined using the unpaired t test. (C) SDS-PAGE profile of affinity-purified Trx·His-Os GID1 and its homologs. Circles indicate the recombinant proteins with approximately the expected molecular sizes (Os GID1, 57.0 kD; Sm GID1a, 57.7 kD; Sm GID1b, 59.2 kD; Pp GID1L1, 55.1 kD; and Pp GID1L2, 56.1 kD). The identification of protein corresponding to Os GID1 and its homologs was confirmed by immunoblot analysis using an Os GID1 antibody (data not shown). Although several bands were observed in each of the Sm GID1 lanes, the immunoreacting band was considered to be Sm GID1 protein, and it was concluded that the other bands were the result of degradation, immaturely transcribed protein, or protein unrelated to Sm GID1s. Approximately equal amounts (∼16 μg) of protein were used for the GA binding assay. (D) to (F) Isothermal titration calorimetry analysis of the Pp GID1L–GA interaction. The heat exchange versus molar ratio for Trx·His-GID1 with titration of GA is shown. (D) Integrated titration curve of Trx·His-Os GID1 with GA4. The line represents the best fitting curve calculated from a single-site binding model. (E) Integrated titration curve of Trx·His-Pp GID1L1 with epi-GA4 (red line), GA9 (blue line), and GA12 (green line). (F) Integrated titration curve of Trx·His-Pp GID1L2 with epi-GA4 (red line), GA9 (blue line), and GA12 (green line).
Figure 6.
Figure 6.
Interaction between GID1 and DELLA Homologs in Yeast Cells. (A) Interaction of various combinations of GID1 and DELLA proteins from rice, S. moellendorffii, and P. patens. GID1 proteins and DELLA proteins were used as bait and prey, respectively. β-Gal activity was detected in a liquid assay with Y187 transformants (means ± sd; n = 3). Only results in the presence of 10−5 M GA4 are presented, since no activity > 1.4 Millar units was detected in the absence of GA4 in any combination. (B) and (C) Effects of various GAs on the Sm GID1s–Sm DELLA1 interaction in yeast cells. A two-hybrid assay was performed using Sm GID1s as bait and Sm DELLA1 as prey in the presence of 10−5 M of various GAs. β-Gal activity was determined as in (A) (means ± sd; n = 3). (D) Chemical structures of GAs used in this study. Structures essential for bioactive GAs are circled in gray (free 2β- and 3β-hydroxylation of the A-ring, γ-lactone structure in the A-ring, and carboxylation of C7). The characteristic structure of each GA compared with GA4 is highlighted in gray. H2-GA4, 16,17-dihydro-GA4; GA4-Me, GA4 methyl ester; GA9-Me, GA9 methyl ester.
Figure 7.
Figure 7.
Dose-Dependence of GA4, GA1, GA3, GA9, and 3-epi-GA4 in the Sm GID1s–Sm DELLA1 Interaction in Yeast Cells. Two-hybrid assay using Sm GID1 proteins as bait and Sm DELLA1 as prey in the presence of various concentrations of GA4 (A), GA1 (B), GA3 (C), GA9 (D), and 3-epi-GA4 (E). β-Gal activity was determined as in Figure 6A (means ± sd; n = 3). The 50% saturation points are indicated by arrows.
Figure 8.
Figure 8.
Complementation of the Dwarf Phenotype of Rice gid1 and gid2 Mutants by Expression of Sm GID1s, Sm GID2a, and Pp GID2L1, and Phenotypic Analysis of Rice Overproducers of Sm DELLAs and Pp DELLAL1. (A) Gross morphology of the wild type, gid1-3, and Sm GID1a and Sm GID1b overproducers in gid1-3 mutants at the young seedling stage. Expression of Sm GID1a and Sm GID1b completely and partially complemented the gid1-3 dwarf phenotype, respectively. (B) Gross morphology of the wild type and Sm DELLA1, Sm DELLA2, and Pp DELLAL1 overproducers in wild-type T65 plants. The panels at bottom present the results of RT-PCR analysis of each transcript of the transgene. Higher expression of Sm DELLA1 was associated with more severe dwarfism of transformants, while there was no dwarfism in transformants highly expressing Sm DELLA2 or Pp DELLAL1. The Os ACT1 gene was used as an internal standard to ensure that the same amount of cDNA was used as the DNA template in each PCR. Results presented are representative of three independent experiments. (C) Gross morphology of the wild type, gid2-1, and Sm GID2a and Pp GID2L1 overproducers in the gid2-1 mutant at the young seedling stage. Only Sm GID2a partially complemented the gid2-1 dwarf phenotype.
Figure 9.
Figure 9.
Expression of GA Signaling Genes in S. moellendorffii. (A) PCR was performed using genomic DNA from S. moellendorffii or cDNA produced from the apical part of vegetative shoots as a DNA template. The results of genomic PCR indicate that the primers for each gene work similarly. Compared with other genes, Sm GID1b is preferentially expressed in the apical part of vegetative shoots. The number of PCR cycles used is shown at right. (B) RT-PCR of GA signaling genes in various organs of S. moellendorffii. Total RNA was isolated from the organs indicated at the top, and 2 μg was used for the RT reaction. “Roots” indicates a mixture of roots and rhizophores, and “apices” indicates apical parts of the vegetative shoot. Expression of the Sm 6PGD gene, an ortholog of the Sr 6PGD gene (Tanabe et al., 2003), was used as a control. The number of PCR cycles used is shown at right. Results presented are representative of at least three independent experiments.
Figure 10.
Figure 10.
Effects on Growth, Feedback Regulation of GA-Related Genes, and Degradation of Sm DELLA1 of GA4 Treatment in S. moellendorffii. (A) Gross morphology of 10−5 M GA4-treated and 10−6 M uniconazole-treated plants. Ethanol (0.01%) solution was used as a control. The positions of corresponding small leaves on each plant are connected with white lines. EtOH, ethanol; uni, uniconazole. (B) Length of stem between the second and third small leaves from the bottom (±se; n = 12, 20, and 10 for GA4, ethanol, and uniconazole treatments, respectively). ** Significant difference (P < 0.01) compared with control (ethanol) treatment from the unpaired t test analysis. (C) Downregulation of GA-related genes in S. moellendorffii after GA4 treatment. Plants were treated for 3 d with or without GA4 at a concentration of 10−4 M, total RNA was isolated from young shoots, and RT-PCR was performed. The Sm 6PGD gene was used as a control. Results presented are representative of at least three biological replicates. (D) Disappearance of Sm DELLA1 protein after GA4 treatment. S. moellendorffii plants were treated with either buffer only or 10−4 M GA4 for 12 h. Sm DELLA1 protein was detected by immunoblot analysis of crude protein extract using the anti-Sm DELLA1 antibody. The specificity of the antibody was confirmed using transgenic rice overexpressing Sm DELLA1 (positive control) and transgenic rice possessing vector only (negative control).
Figure 11.
Figure 11.
GA Content and in Vitro Activity of GA20 Oxidase and GA3 Oxidase Homologs in S. moellendorffii. (A) The late stage of GA biosynthesis. In many flowering plants, GA12 is often converted to GA53 by hydroxylation at C-13. GA12 or GA53 is converted, via parallel pathways, to other GAs through a series of oxidations at C-20 to finally form GA9 or GA20 by GA20 oxidase. GA9 or GA20 is oxidized to the bioactive GA4 or GA1 by GA3 oxidase. Sm GA20ox can catalyze the steps from GA12 to GA15, from GA24 to GA9, and from GA53 to GA44 (circles), but not from GA19 to GA20 (crosses). Sm GA3ox catalyzes the step from GA9 to GA4 but not the step from GA20 to GA1. (B) GA content of S. moellendorffii shoots. One gram of S. moellendorffii shoots was used for GA content measurement by liquid chromatography–mass spectrometry analysis (see Methods). Tests were performed on four independent plants. Error bars indicate sd. FW, fresh weight; N.D., no expected product was detected. (C) In vitro enzymatic activity of GA20 oxidase and GA3 oxidase homologs in S. moellendorffii. N.D., no expected product was detected.

References

    1. Adachi, J., and Hasegawa, M. (1996). MOLPHY version 2.3: Programs for molecular phylogenetics based on maximum likelihood. Comput. Sci. Monogr. 28 1–150.
    1. Altschul, S.F., Madden, T.L., Schaffer, A.A., Zhang, J., Zhang, Z., Miller, W., and Lipman, D.J. (1997). Gapped BLAST and PSI-BLAST: A new generation of protein database search programs. Nucleic Acids Res. 25 3389–3402. - PMC - PubMed
    1. Ashton, N.W., and Cove, D.J. (1977). The isolation and preliminary characterisation of auxotrophic and analogue resistant mutants in the moss Physcomitrella patens. Mol. Gen. Genet. 154 87–95.
    1. Banks, J.A. (1999). Gametophyte development in ferns. Annu. Rev. Plant Physiol. Plant Mol. Biol. 50 163–186. - PubMed
    1. Bolle, C. (2004). The role of GRAS proteins in plant signal transduction and development. Planta 218 683–692. - PubMed

Publication types

MeSH terms