. 2007 Dec;13(12):1490-5.
doi: 10.1038/nm1675. Epub 2007 Oct 28.

A critical developmental switch defines the kinetics of kidney cyst formation after loss of Pkd1

Affiliations

A critical developmental switch defines the kinetics of kidney cyst formation after loss of Pkd1

Klaus Piontek et al. Nat Med. 2007 Dec.

Abstract

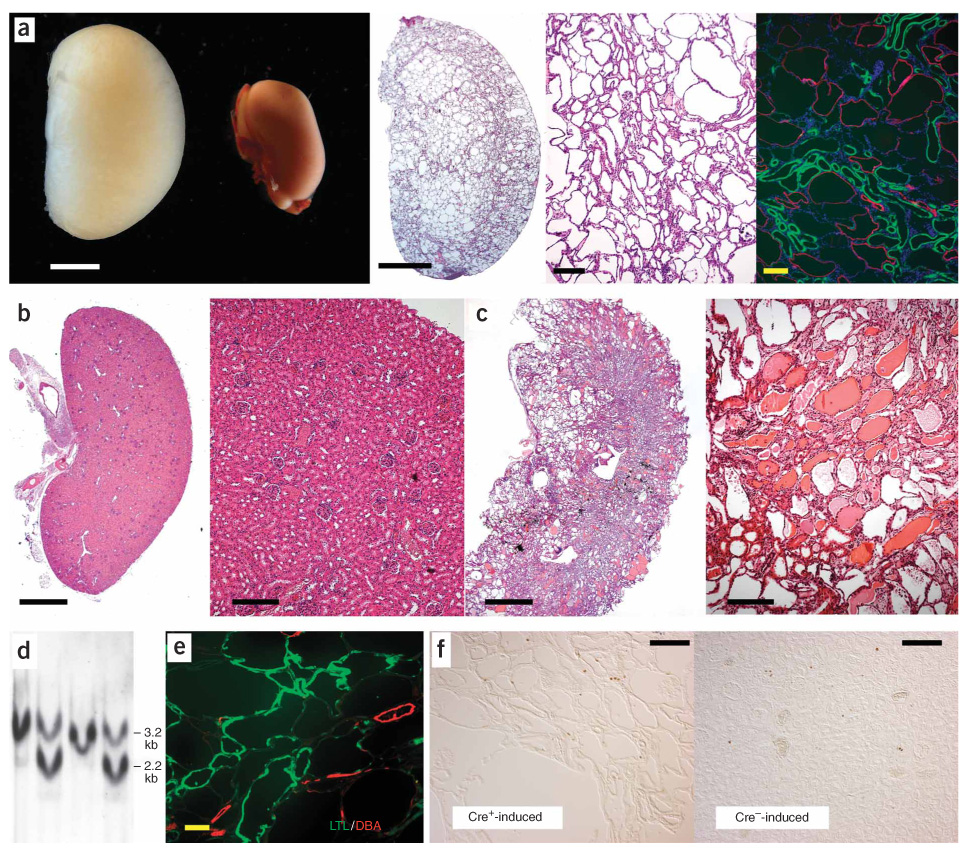
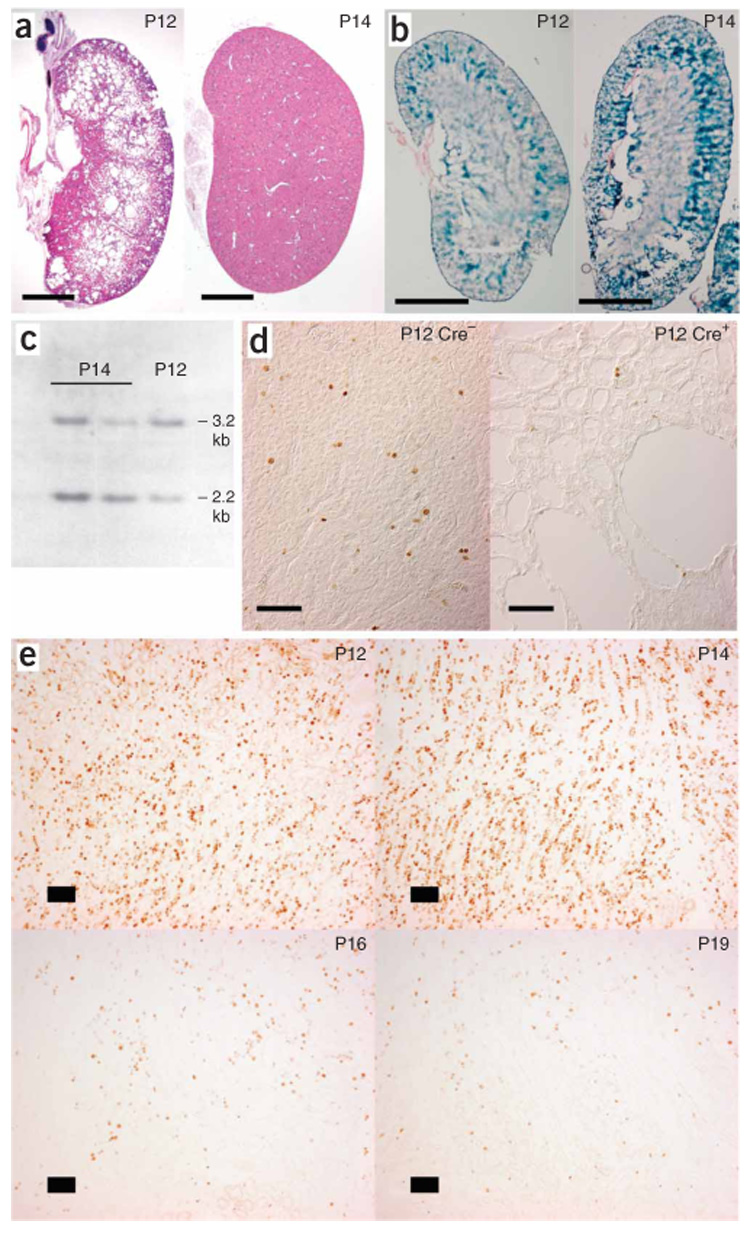
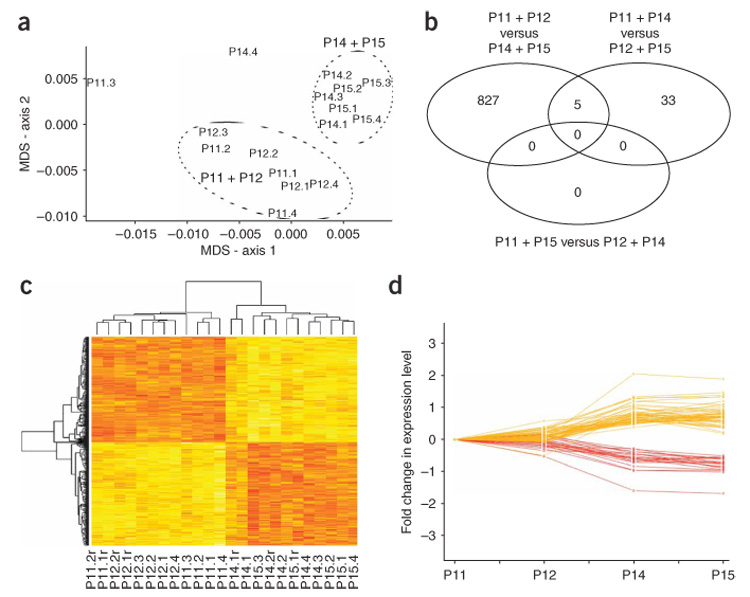
Autosomal dominant polycystic kidney disease is an important cause of end-stage renal disease, for which there is no proven therapy. Mutations in PKD1 (the gene encoding polycystin-1) are the principal cause of this disease. The disease begins in utero and is slowly progressive, but it is not known whether cystogenesis is an ongoing process during adult life. We now show that inactivation of Pkd1 in mice before postnatal day 13 results in severely cystic kidneys within 3 weeks, whereas inactivation at day 14 and later results in cysts only after 5 months. We found that cellular proliferation was not appreciably higher in cystic specimens than in age-matched controls, but the abrupt change in response to Pkd1 inactivation corresponded to a previously unrecognized brake point during renal growth and significant changes in gene expression. These findings suggest that the effects of Pkd1 inactivation are defined by a developmental switch that signals the end of the terminal renal maturation process. Our studies show that Pkd1 regulates tubular morphology in both developing and adult kidney, but the pathologic consequences of inactivation are defined by the organ's developmental status. These results have important implications for clinical understanding of the disease and therapeutic approaches.


Figures

Figure 1
Figure 1
Time of inactivation determines renal response to acquired Pkd1 loss. (a) Early inactivation of Pkd1 results in rapidly progressive renal cystic disease. Shown are P19 kidneys of Pkd1cond/cond; tamoxifen-Cre+ and Pkd1cond/cond; tamoxifen-Cre mice in which Pkd1 was inactivated on P2. Far left, comparison of gross exam of Cre+ (left) and Cre (right) kidneys. Middle, H&E stains of P19 cystic kidney showing cystic involvement of all nephron segments. Far right, P19 cystic kidney stained with markers for proximal tubule (LTL, green), distal tubule (DBA, red) and nuclei (DAPI, blue), showing that both types of tubules are cystic. Cysts that shared staining for specific markers appeared to be homogeneous in size, consistent with their common time of initiation. Scale bars, 2 mm (left and middle); 100 µm (right). (b,c) Adult inactivation results in late-onset renal cystic disease. Shown is H&E staining of kidneys harvested 3 months (b) or 6 months (c) after Pkd1 inactivation was induced in 6-week-old Pkd1cond/cond; tamoxifen-Cre+ mice. Scale bars, 2 mm (left); 100 µm (right). (d) Southern blotting analysis of kidney DNA harvested 3 months after induction of Pkd1 inactivation in 6-week-old Pkd1cond/cond; tamoxifen-Cre+ mice (lanes 2 and 4) and Pkd1cond/cond; tamoxifen-Cre mice (lanes 1 and 3). The EcoRI 2.2-kilobase (kb) band is the new fragment resulting from Cre-mediated deletion. (e,f) LTL (green) and DBA (red) staining of cystic kidneys from Pkd1cond/cond; tamoxifen-Cre+ mice (e), and Ki-67 staining of kidney sections from Pkd1cond/cond; tamoxifen-Cre+ (left) and Pkd1cond/cond; tamoxifen-Cre mice (right) (f), 6 months after Cre induction in 6-week-old mice. Scale bars, 50 µm (e); 100 µm (f).
Figure 2
Figure 2
Susceptibility to rapid-onset cystic disease switches off between P12 and P14. (a) Kidneys of Pkd1cond/cond; tamoxifen-Cre+ mice induced at P12 were cystic within 3 weeks (left), whereas those of mice induced at P14 remained normal 3 months later (right). Scale bar, 2 mm. (b) β-galactosidase staining of kidneys of ROSA26R mice 5 d after induction at P12 (left) and P14 (right), showed that the samples have similar patterns and rates of Cre-mediated induction. Scale bar, 2 mm. (c) Southern blot of kidney DNA isolated from Pkd1cond/cond; tamoxifen-Cre+ mice harvested 5 d after induction at P12 and P14. (d) Ki67-stained sections of Pkd1cond/cond; tamoxifen-Cre+ (left) and Pkd1cond/cond; tamoxifen-Cre (right) kidneys 3 weeks after induction at P12. Scale bar, 200 µm. (e) Ki67-stained sections of uninduced Pkd1cond/cond; tamoxifen-Cre; ROSA26R+ kidneys harvested on P12–P19. Similar results were obtained for kidneys of uninduced Pkd1cond/cond; tamoxifen-Cre+; ROSA26R+ mice (data not shown). Scale bar, 100 µm.
Figure 3
Figure 3
Abrupt brake point in rate of renal proliferation parallels marked changes in gene expression. (a) Multidimensional scaling analysis (MDS) of the microarray data revealed that the samples clustered in two groups, separating P11 + P12 (P11 and P12) and P14 + P15 (P14 and P15) kidneys. (b) Venn diagram showing that a much larger subset of genes varied between P11 + P12 and P14 + P15 than between other possible groups (fdr-adjusted P < 1 × 10⁻³). (c) Heatmap plot of genes (n = 827, Supplementary Table 2) that varied between the P11 + P12 and P14 + P15 groups, showing a clear switch between the two groups (yellow, greater expression than the mean expression at P11; red, less expression than the mean at P11). (d) Plot of fold change in mean expression level at each time point, for genes with fdr-adjusted P < 1 × 10⁻³ and at least a twofold change in expression, in at least one sample, as compared to mean expression at P11 (n = 72, Supplementary Table 3).

Comment in

Similar articles

Cited by

References

    1. Boucher C, Sandford R. Autosomal dominant polycystic kidney disease (ADPKD, MIM 173900, PKD1 and PKD2 genes, protein products known as polycystin-1 and polycystin-2) Eur. J. Hum. Genet. 2004;12:347–354. - PubMed
    1. Pretorius DH, et al. Diagnosis of autosomal dominant polycystic kidney disease in utero and in the young infant. J. Ultrasound Med. 1987;6:249–255. - PubMed
    1. Piontek KB, et al. A functional floxed allele of Pkd1 that can be conditionally inactivated in vivo. J. Am. Soc. Nephrol. 2004;15:3035–3043. - PubMed
    1. Lu W, et al. Perinatal lethality with kidney and pancreas defects in mice with a targetted Pkd1 mutation. Nat. Genet. 1997;17:179–181. - PubMed
    1. Bukanov NO, Smith LA, Klinger KW, Ledbetter SR, Ibraghimov-Beskrovnaya O. Long-lasting arrest of murine polycystic kidney disease with CDK inhibitor roscovitine. Nature. 2006;444:949–952. - PubMed

Publication types

Substances