. 2007 Nov;117(11):3306-15.
doi: 10.1172/JCI31763.

Glia-dependent TGF-beta signaling, acting independently of the TH17 pathway, is critical for initiation of murine autoimmune encephalomyelitis

Affiliations

Glia-dependent TGF-beta signaling, acting independently of the TH17 pathway, is critical for initiation of murine autoimmune encephalomyelitis

Jian Luo et al. J Clin Invest. 2007 Nov.

Abstract

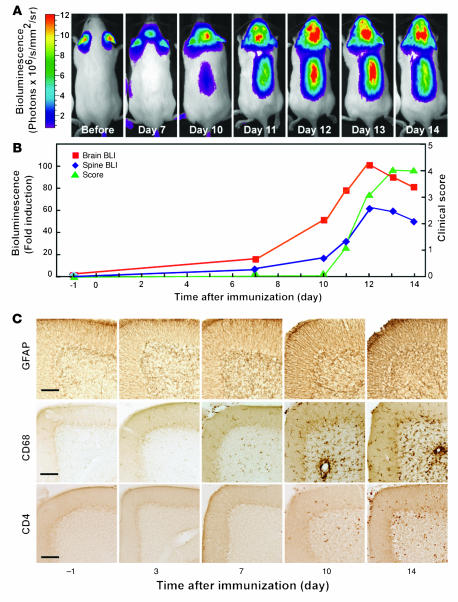
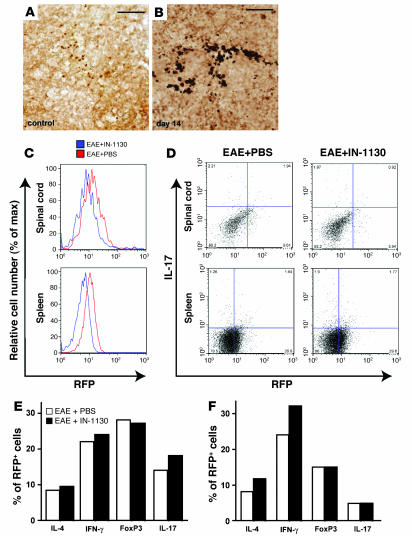
Autoimmune encephalomyelitis, a mouse model for multiple sclerosis, is characterized by the activation of immune cells, demyelination of axons in the CNS, and paralysis. We found that TGF-beta1 synthesis in glial cells and TGF-beta-induced signaling in the CNS were activated several days before the onset of paralysis in mice with autoimmune encephalomyelitis. While early production of TGF-beta1 was observed in glial cells TGF-beta signaling was activated in neurons and later in infiltrating T cells in inflammatory lesions. Systemic treatment with a pharmacological inhibitor of TGF-beta signaling ameliorated the paralytic disease and reduced the accumulation of pathogenic T cells and expression of IL-6 in the CNS. Priming of peripheral T cells was not altered, nor was the generation of TH17 cells, indicating that this effect was directed within the brain, yet affected the immune system. These results suggest that early production of TGF-beta1 in the CNS creates a permissive and dangerous environment for the initiation of autoimmune inflammation, providing a rare example of the brain modulating the immune system. Importantly, inhibition of TGF-beta signaling may have benefits in the treatment of the acute phase of autoimmune CNS inflammation.


Figures

Figure 1
Figure 1. Astrogliosis and neuroinflammation precede clinical signs in EAE.
(A and B) EAE was induced in GFAP-luc mice with MOG35–55 emulsified in CFA plus PT, and bioluminescence was recorded in living mice (n = 7) injected with luciferin (150 mg/kg) 1 day before (–1) and at 3, 7, 10, or 14 dpi. Time course of bioluminescence recorded in a representative mouse (A) and the bioluminescence expressed as fold induction plotted with clinical score (B). (C) Mice were sacrificed at indicated time points. Sagittal brain sections from control (–1) or EAE mice sacrificed at different time points were examined for neuroinflammation, and images were taken from cerebellum. Neuroinflammation was assessed by immunohistochemistry as a function of astrogliosis (GFAP), microgliosis (CD68), and T lymphocyte infiltration (CD4). Scale bars: 100 μm.
Figure 2
Figure 2. Double immunolabeling and confocal microscopy shows TGF-β1 expression in glial cells but not infiltrating lymphocytes.
GFAP-luc mice were immunized with MOG35–55 and adjuvants (BF) or injected with PBS as control (A). (AC) Sagittal brain sections from control (A) or EAE mice sacrificed at 7 (B) or 14 (C) dpi were immunostained for TGF-β1, and images were taken from cerebellum. Inserts show boxed regions at higher magnification. (DF) Confocal microscope images from brain sections of an EAE mouse sacrificed at 7 dpi and double immunolabeled with antibodies against TGF-β1 (green) and cell type–specific markers CD68 (microglia, D), GFAP (astrocytes, E), and CD4 (T cell subset, F) (red). TGF-β1–expressing cells appear yellow after superimposition. Scale bars: 100 μm (AC); 20 μm (DF).
Figure 3
Figure 3. Early activation of TGF-β signaling in brains of SBE-luc (A) or SBE-lucRT (BH) mice after immunization.
(A) Time course showing bioluminescence signals indicative of TGF-β signaling in a representative SBE-luc mouse. (BH) Activation of TGF-β signaling indicated by reporter gene expression in neurons and infiltrating lymphocytes. SBE-lucRT mice were immunized with MOG35–55 and adjuvants (CE) or injected with PBS as control (B). (BE) Sagittal brain sections were stained for RFP, and images were taken from the cerebellum granule cell layer. (FH) Confocal microscope images of double immunolabeling with antibodies against RFP (green) and cell type–specific markers (red): CD68 (microglia, F), GFAP (astrocyte, G), and CD4 (T cell subset, H). RFP-expressing cells appear yellow after superimposition. Sections were from a mouse sacrificed at 14 dpi (DE). Scale bars: 50 μm (AE); 20 μm (FH). Insets in H show RFP-expressing CD4+ T cells in cerebellum parenchyma. Scale bar: 20 μm.
Figure 4
Figure 4. Pharmacological inhibition of TGF-β signaling ameliorates EAE.
GFAP-luc mice (AC, n = 4–7 per group) or SBE-luc mice (D, n = 10–12 per group) were immunized with MOG35–55 emulsified in CFA and treated with the TGF-β receptor kinase inhibitor IN-1130 (closed symbols) or PBS (open symbols) from 1–14 (AC) or 3–14 (D) dpi. Daily bioluminescence and clinical assessment (weight loss, C; clinical score, D) were recorded in a blinded manner. Bioluminescence is shown from representative mice of each group individually (A) or as mean ± SEM (B). Similar results were obtained in 2 independent experiments. Data are shown as mean ± SEM.
Figure 5
Figure 5. Inhibition of TGF-β signaling leads to reduced T cell accumulation and TGF-β1–dependent gene expression in the spinal cord.
SBE-luc mice (A, B, D, E, and F, n = 3–4 per group) or GFAP-luc mice (C, n = 4–7 per group) were immunized with MOG35–55 emulsified in CFA and treated with IN-1130 (black bars) or PBS (white bars). Mice were sacrificed at indicated time points (B, D, and E) or at 14 dpi (C). (AC) Spinal cord cross sections (n = 2–4 per mouse) were stained with an antibody against CD3 to assess T cell accumulation. (A) Representative images from spinal cord sections of SBE-luc mice sacrificed at 11 dpi. (DF) Relative levels of TGF-β1 (D), IL-6 (E), and IL-23 (F) expression in the spinal cords of SBE-luc mice measured by quantitative real-time PCR. Bars show mean ± SEM. **P < 0.01 compared with EAE plus PBS. Scale bar: 100 μm.
Figure 6
Figure 6. Inhibition of TGF-β signaling by IN-1130 does not significantly affect the distribution of CD4 T cell subsets.
C57BL/6 mice were immunized with MOG35–55 emulsified in CFA plus PT and treated with IN-1130 or PBS (i.p.) daily from 1–14 dpi. T cells were isolated from spinal cords and spleens of 6 mice combined at 20 dpi. Cells were stained with antibodies against CD4 in combination with IL-4, IFN-γ, Foxp3, and IL-17 and analyzed by flow cytometry. (A) Dot plots of IL-17 expression in CD4+ T cells from spinal cord (top panels) or spleen (bottom panels). (B and C) Percentages of CD4 T cell subsets expressing the indicated intracellular markers from spinal cord (B) and spleen (C). No significant differences were observed in any of the percentages between IN-1130 (black bars) and PBS-treated (white bars) mice by FlowJo population comparison; T(X) = 0.
Figure 7
Figure 7. Treatment of IN-1130 inhibits TGF-β signaling but does not significantly affect the distribution of CD4 T cell subsets with activated TGF-β signaling.
(A and B) Activation of TGF-β signaling in lymphocytes from spleen sections of SBE-luRT mice with EAE (B) or no disease (A). Spleens were cut transversely at 40 μm and the sections were stained for RFP (brain sections of the same mice are shown in Figure 3). (CF) Flow cytometry analysis of T cells isolated from the spinal cord and spleen of IN-1130 or PBS-treated SBE-lucRT mice at 14 dpi (n = 5 mice per group combined). Cells were stained with antibodies against RFP in combination with CD4, IL-4, IFN-γ, Foxp3, and IL-17. (C) IN-1130 significantly inhibits RFP expression in CD4+ T cells isolated from spinal cord (top panel) or spleen (bottom panel; FlowJo population comparison; T(X) = 39.7 for spinal cord, 1,240 for spleen). (D) Dot plots of all RFP+ cells expressing IL-17. (E and F) Percentages of RFP+ cells expressing the indicated intracellular markers in the spinal cord (E) and spleen (F). No significant differences were observed in any of the percentages between IN-1130 (black bars) and PBS-treated (white bars) mice by FlowJo population comparison; T(X) = 0.

References

    1. Steinman L. Multiple sclerosis: a coordinated immunological attack against myelin in the central nervous system. Cell. 1996;85:299–302. - PubMed
    1. Steinman L. Multiple sclerosis: a two-stage disease. Nat. Immunol. 2001;2:762–764. - PubMed
    1. Gold R., Linington C., Lassmann H. Understanding pathogenesis and therapy of multiple sclerosis via animal models: 70 years of merits and culprits in experimental autoimmune encephalomyelitis research. Brain. 2006;129:1953–1971. - PubMed
    1. Steinman L. Assessment of animal models for MS and demyelinating disease in the design of rational therapy. Neuron. 1999;24:511–514. - PubMed
    1. Massagué J., Blain S.W., Lo R.S. TGF-β signaling in growth control, cancer, and heritable disorders. Cell. 2000;103:295–309. - PubMed

Publication types

MeSH terms

Substances