. 2007 Nov;117(11):3551-62.
doi: 10.1172/JCI32526.

Squamous metaplasia amplifies pathologic epithelial-mesenchymal interactions in COPD patients

Affiliations

Squamous metaplasia amplifies pathologic epithelial-mesenchymal interactions in COPD patients

Jun Araya et al. J Clin Invest. 2007 Nov.

Abstract

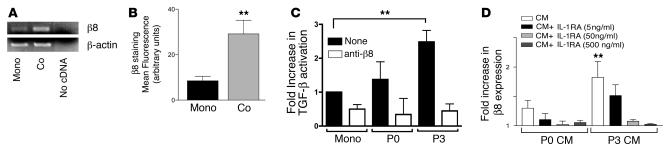
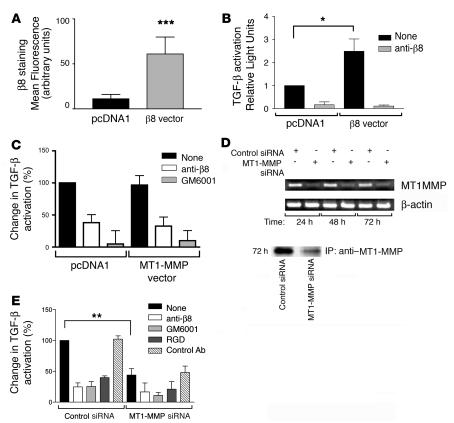
Squamous metaplasia (SM) is common in smokers and is associated with airway obstruction in chronic obstructive pulmonary disease (COPD). A major mechanism of airway obstruction in COPD is thickening of the small airway walls. We asked whether SM actively contributes to airway wall thickening through alteration of epithelial-mesenchymal interactions in COPD. Using immunohistochemical staining, airway morphometry, and fibroblast culture of lung samples from COPD patients; genome-wide analysis of an in vitro model of SM; and in vitro modeling of human airway epithelial-mesenchymal interactions, we provide evidence that SM, through the increased secretion of IL-1beta, induces a fibrotic response in adjacent airway fibroblasts. We identify a pivotal role for integrin-mediated TGF-beta activation in amplifying SM and driving IL-1beta-dependent profibrotic mesenchymal responses. Finally, we show that SM correlates with increased severity of COPD and that fibroblast expression of the integrin alpha(v)beta(8), which is the major mediator of airway fibroblast TGF-beta activation, correlated with disease severity and small airway wall thickening in COPD. Our findings have identified TGF-beta as a potential therapeutic target for COPD.


Figures

Figure 1
Figure 1. SM correlates with increased GOLD stage of COPD in human lung samples, and SM can be induced during in vitro culture.
(A) Involucrin (IVL), a marker of epidermal differentiation (26), stains small airway SM. Shown is a photomicrograph of metaplastic squamous cells (arrows) of a small airway from a COPD patient stained with anti-IVL. Scale bar: 50 μm. (B) IVL-staining intensity of lung samples from normal versus COPD patients stratified according to GOLD (www.goldcopd.com), and assessed by grading digital images (0–3 scale) with 0 being absent; grade 1, 0–10%; grade 2, 11–20%; and grade 3, >20% cytoplasmic staining. *P < 0.05. (C) Photomicrographs of P0 compared with P3 human bronchial epithelial cells. Upper panels are stained with the basal cell marker anti-p63 and lower panels with anti-IVL. Scale bar: 50 μm. (D) Western blotting of 40 μg of P0 or P3 human bronchial epithelial cells total cell lysates for p63 and IVL. (E) Propidium iodide (PI) staining and flow cytometry of serially passaged human bronchial epithelial cells of a representative experiment (n = 3) showing the relative proportion of cells in the G0/G1, S, and G2/M phases of the cell cycle. (F) Relative proportion (± SEM) of human bronchial epithelial cells (n = 3) in G0/G1 compared with S and G2/M phases of the cell cycle during serial passage. *P < 0.01. (G) Senescence-associated β-gal (SA β-gal) staining of serially passaged human bronchial epithelial cells (n = 3). Shown is the percentage (± SEM) of SA β-gal–positive cells. *P < 0.01; **P < 0.001.
Figure 2
Figure 2. IL-1α and IL-1β are induced during SM.
(A) RT-PCR of total RNA from P0 to P3 human bronchial epithelial cells grown in 2D culture, using primers to IL-1α and IL-1β and β-actin, as a control. Shown is a representative experiment from paired samples from 3 different patients with the same results. (B) Antibody cytokine array showing increased IL-1β and -α in conditioned medium taken from P0 or P3 human bronchial epithelial cells. Upper and lower panels are duplicates. Shown is a representative experiment from 3 separate patients showing similar results. (C) IL-1β ELISA assay showing increased IL-1β in conditioned medium from P0 compared with P3 human bronchial epithelial cells. **P < 0.001. (D) Involucrin immunostaining of P0 human bronchial epithelial cells grown in air-liquid interface culture for 21 days. Human bronchial epithelial cells grown in 2% Ultraser G (Invitrogen) produced differentiated pseudostratified ciliated columnar epithelium (NL, upper panel). When grown in BEGM (Clonetics), the cells adopted a squamous metaplastic phenotype and expressed involucrin (SM, lower panel). Arrows indicate involucrin staining of basal and suprabasal squamous metaplastic epithelial cells. Scale bar: 20 μm. (E) RT-PCR of total RNA harvested from human bronchial epithelial cells grown in air-liquid interface for 3 days or 21 days in differentiating medium (USG) or SM medium (BEGM) using primers to IL-1β or β-actin as controls.
Figure 3
Figure 3. IL-1β is coexpressed with integrins αvβ6 and αvβ8 in hyperproliferative suprabasal squamous metaplastic airway epithelium of COPD patients.
Immunostaining of adjacent paraffin sections from an airway with a focus of SM (Sq. Met.: A, C, E, G, I, K, M, O, and Q) compared with relatively normal airway mucosa (B, D, F, H, J, L, N, P, and R) from a COPD patient using antibodies to (A and B) IL-1β; (C and D) IL-1β preabsorbed with the immunogenic peptide (control); (E and F) the suprabasal markers anti-involucrin; (G and H) anti–keratin 6; (I and J) anti–keratin 14; (K and L) the TGF-β activating integrins β6; (M and N) and β8; (O and P) the cell proliferation marker Ki-67; (Q and R) the basal cell marker p63. Arrows point to the basement membrane. Shown is a representative experiment of 3 showing similar results. Scale bar: 100 μm.
Figure 4
Figure 4. Paracrine secretion of IL-1β by P3 human bronchial epithelial cells increases β8 expression and αvβ8-mediated TGF-β activation of adjacent airway fibroblasts in a coculture model of the epithelial-mesenchymal trophic unit.
Normal adult airway fibroblasts were cultured alone (Mono) or cocultured (Co) with P3 human bronchial epithelial cells grown on filter inserts. (A) Total fibroblast RNA was harvested and RT-PCR performed using primers specific for β8 or β-actin, as a control. Shown is a representative experiment of 3 with similar results. No cDNA indicates a no template control. (B) Fibroblasts (n = 3) in mono- or coculture were stained with anti-β8 and analyzed by flow cytometry. Shown is mean fluorescence in arbitrary units. (C) Monocultured fibroblasts or fibroblasts after 48-hour coculture with P0 or P3 human bronchial epithelial cells (n = 6) were cocultured with TGF-β reporter cells in the presence of neutralizing anti-β8, or no antibody (none). Shown is fold increase in TGF-β activation relative to untreated fibroblasts in monoculture. (D) Airway fibroblasts (n = 3) were cocultured with P0 or P3 conditioned medium (CM) in the presence of no antagonist or different concentrations (5, 50, or 500 ng/ml) of IL-1RA, a naturally occurring soluble antagonist of IL-1α and IL-1β. The fibroblasts were stained with anti-β8 and analyzed using flow cytometry. Shown is the fold increase in β8 expression compared with matched airway fibroblasts grown without conditioned medium. **P < 0.001.
Figure 5
Figure 5. Autocrine αvβ8-mediated TGF-β activation regulates the airway fibroblast contractile phenotype and collagen production.
siRNA to β8 or a control siRNA were transfected into normal adult airway fibroblasts and 72 hours following transfection were analyzed. (A) RT-PCR using primers to β8 or β-actin as a control. Shown is a representative experiment of 4 showing similar results. (B) Flow cytometry using anti-β8. Shown is mean fluorescence (n = 4) in arbitrary units ± SEM. *P < 0.05. (C) The TGF-β reporter cell line, TMLC, in the presence of anti-β8 or isotype-matched control antibodies (n = 3). TGF-β activation is shown as relative to the total TGF-β activation seen in control antibody, control siRNA–treated cells. *P < 0.05, **P < 0.001. (D) Western blot (WB) using anti-αSMA or RT-PCR using primers to αSMA or β-actin as a control. Shown is a representative experiment of 3 showing similar results. (E) RT-PCR of fibroblasts cultured alone (monoculture) or in coculture treated with either a control antibody (control Ab) or IL-1RA using primers to Col I or β-actin as a control, or Western blot using anti–Col I. Shown is a representative experiment of 3 showing similar results.
Figure 6
Figure 6. Increased αvβ8-mediated activation of TGF-β in airway fibroblasts is mediated through increased β8 expression and not increased MT1-MMP activity.
(A) Airway fibroblasts (n = 4) were transiently transfected with a control vector (pcDNA1) or β8 expression construct and assessed for β8 expression by flow cytometry using anti-β8. ***P < 0.001. (B) Control or β8 transfectants (n = 3) were cocultured with TGF-β reporter cells in the presence or absence of neutralizing anti-β8. Shown is TGF-β activation relative to mock-transfected control. *P < 0.05. (C) Airway fibroblasts transfected with a control or MT1-MMP expression vector were cocultured with TGF-β reporter cells in the presence or absence of neutralizing anti-β8 or the metalloprotease inhibitor GM6001. TGF-β activation was determined using a pan–TGF-β blocking antibody. (D) Airway fibroblasts were transfected with control siRNA or MT1-MMP siRNA and assessed for MT1-MMP expression by RT-PCR using primers to MT1-MMP or β-actin as a control at 24, 48, or 72 hours (upper panel). In the lower panel, transfected airway fibroblasts 72 hours after transfection were surface labeled. Cell lysates were immunoprecipitated with anti–MT1-MMP. Shown is a representative experiment of 3, showing similar results. (E) Airway fibroblasts (n = 3) transfected with control or MT1-MMP siRNA were cocultured with TGF-β reporter cells in the presence or absence of anti–TGF-β, anti-β8, a pan-metalloprotease inhibitor, GM6001, a TGF-β1 RGD peptide (20), or isotype-matched control. The percentage of the total TGF-β activation (± SEM) was defined using an anti–TGF-β neutralizing antibody. *P < 0.05; **P < 0.001.
Figure 7
Figure 7. αvβ6-mediated TGF-β activation forms a self-amplifying loop of increasing TGF-β activation in human bronchial epithelial cells, which drives SM.
Normal human bronchial epithelial cells in 2D culture (n = 3) were assessed during serial passage (P0–P3) for integrin αvβ6 and αvβ8 expression by (A, upper panel) RT-PCR using primers specific for β8, β6, or β-actin, as a control or (A, lower panel) flow cytometry using no antibody, anti-β6, or anti-β8 (± SEM). (B) Human bronchial epithelial cells (n = 5) were tested for changes in integrin-mediated TGF-β activation during serial passage using TGF-β bioassay (± SEM). TGF-β activation was determined using pan–anti–TGF-β. (C) P2 human bronchial epithelial cells in 2D culture were treated for 4 days with no primary antibody, neutralizing anti–TGF-β, anti-β8, or anti-β6. RT-PCR was performed using primers to β8, β6, or β-actin, as a control (n = 5). Densitometry values were normalized to β-actin, and the results were expressed as fold decrease (± SE) relative to control antibody–treated cells where a value of 1 represents no change from control antibody–treated cells. *P < 0.05 (D) P2 human bronchial epithelial cells in 2D culture were treated with control antibody or neutralizing anti-β6, and total RNA was harvested and assessed for the EDC genes (42, 43), involucrin (IVL), desmocollin-2 (DSC2), small proline rich protein-1A (SPRR1A), -1B (SPRR1B) (n = 3), -3 (SPRR3), or S100A7 (n = 2) using real-time PCR. Shown is the fold reduction (log 10) in expression of EDC genes after treatment with anti-β6 compared with control antibody–treated samples.
Figure 8
Figure 8. Fibroblast αvβ8-mediated activation of TGF-β contributes to β6 expression by adjacent human bronchial epithelial cells through a paracrine mechanism.
(A) P0 human bronchial epithelial cells were cultured on filter inserts and were cultured alone (monoculture) or cocultured with control siRNA- or β8 siRNA–transfected airway fibroblasts in the bottom chamber treated with control antibody (control Ab) or neutralizing anti–TGF-β for 48 hours. Total human bronchial epithelial cell RNA was harvested, and β6 expression was determined by RT-PCR using primers to β6 or β-actin, as a control. Shown is a representative experiment of 3 showing similar results. (B) P0 human bronchial epithelial cells grown on filter inserts were similarly cocultured alone or with control siRNA (white bar) or β8 siRNA (black bar) transfected airway fibroblasts for 48 hours (n = 5). β6 surface expression was determined by flow cytometry using anti-β6. Shown is increase in surface expression relative to human bronchial epithelial cells in monoculture. Shown is SEM. *P < 0.05.
Figure 9
Figure 9. Expression of the integrin β8 is increased in small airway fibroblasts in COPD; its expression correlates with GOLD stage, airway wall thickness, and TGF-β activation.
Human lung samples obtained from patients with COPD (n = 22) or from normal controls (n = 12) were evaluated for β8 expression by immunostaining (AC), flow cytometry (D), and TGF-β bioassay (E). In A, a histologic section of a small airway with SM is depicted with strong β8 staining in the basal cells (arrowheads) and moderate staining in the adjacent subepithelial fibroblasts (arrows). Scale bar: 50 μm. (B) Average β8 staining intensity is shown for normal lung samples and samples from GOLD stage 1–3 patients based on the 0–3 grading scale (see Methods). *P < 0.05, **P < 0.01. (C) Wall thickness was approximated by measuring the area of the airway wall from the basement membrane (BM) to the adventitia/length of the BM, using the method of Hogg (5). Shown is the relationship between wall thickness and β8 staining intensity. (D and E) Fibroblasts were harvested from lung parenchyma from normal patients (n = 6) or patients with COPD (n = 5) and were (D) stained with anti-β8 and analyzed using flow cytometry or (E) cocultured with TGF-β reporter cells (TMLC) in the presence or absence of neutralizing anti-β8. In D, shown is mean fluorescence intensity ± SE. *P < 0.05. In E, TGF-β activation is expressed as relative to the total light units obtained with anti–TGF-β. *P < 0.05.
Figure 10
Figure 10. Hypothetical model of SM in the pathogenesis of airway wall thickening in COPD.
(a) The normal airway epithelium when exposed to noxious stimuli responds by increasing TGF-β production (12) and increasing TGF-β activation, which increases expression of the β6 integrin, a TGF-β responsive gene (31) contributing to (b) a phenotypic switch to SM, a TGF-β driven process (11). (c) Squamous metaplastic epithelial cells secrete increased IL-1β, which acts a paracrine factor with adjacent airway fibroblasts. (d) Airway fibroblasts respond to IL-1β by increasing β8 expression and αvβ8-mediated TGF-β activation. Increased TGF-β activation by airway fibroblasts causes (e) autocrine effects on the fibrogenic fibroblast phenotype by increasing Col I and αSMA and (f) paracrine effects on adjacent airway epithelium, which inhibits epithelial proliferation (10, 44, 66) and contributes to the increased expression of β6 by adjacent airway epithelial cells, forming a self-amplifying loop of TGF-β activation.

References

    1. Vandevoorde J., et al. Early detection of COPD: A case finding study in general practice. Respir. Med. 2007;101:525–530. - PubMed
    1. International COPD Coalition. 2006. Global burden of COPD summit 2006. http://www.internationalcopd.org/materials/patients/learn/facts.aspx.
    1. Hogg J.C., Macklem P.T., Thurlbeck W.M. Site and nature of airway obstruction in chronic obstructive lung disease. N. Engl. J. Med. 1968;278:1355–1360. - PubMed
    1. Shapiro S.D., Ingenito E.P. The pathogenesis of chronic obstructive pulmonary disease: advances in the past 100 years. Am. J. Respir. Cell Mol. Biol. 2005;32:367–372. - PubMed
    1. Hogg J.C., et al. The nature of small-airway obstruction in chronic obstructive pulmonary disease. N. Engl. J. Med. 2004;350:2645–2653. - PubMed

Publication types

MeSH terms