

Characterization of the arene-oxidizing intermediate in ToMOH as a diiron(III) species
- PMID: 17967027
- PMCID: PMC2494525
- DOI: 10.1021/ja076121h
Characterization of the arene-oxidizing intermediate in ToMOH as a diiron(III) species
Abstract
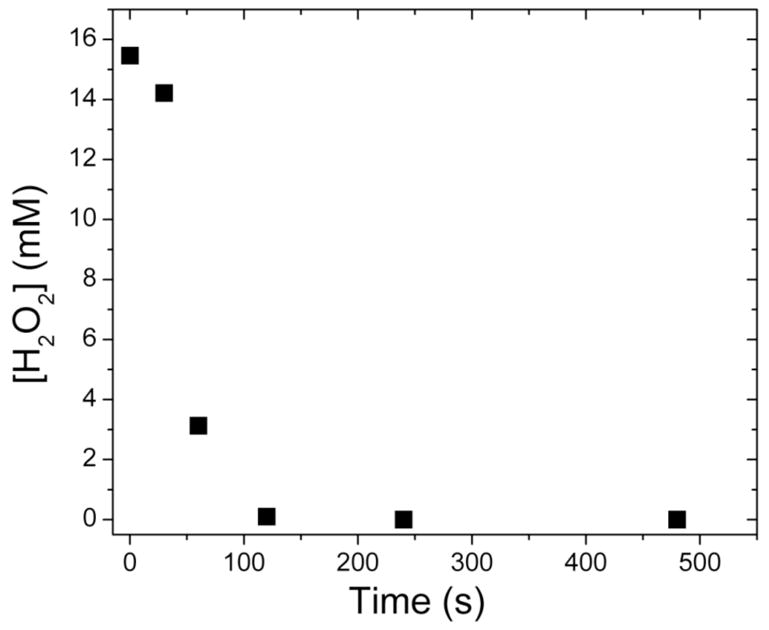
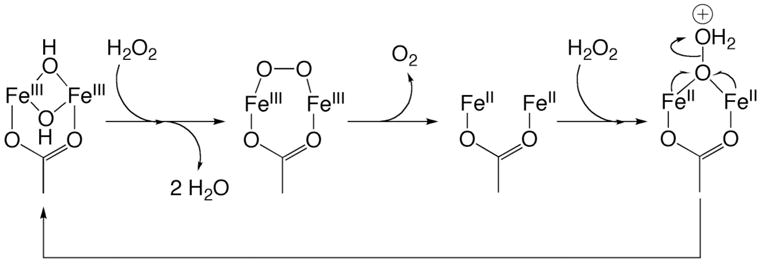
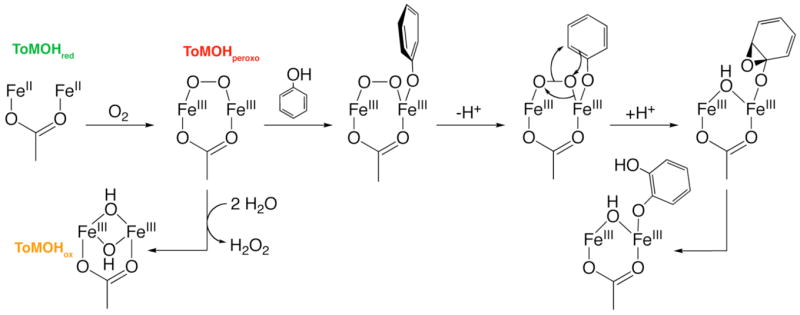
We report the generation and characterization of a diiron(III) intermediate formed during reaction with dioxygen of the reduced hydroxylase component of toluene/o-xylene monooxygenase from Pseudomonas sp. OX1. The decay rate of this species is accelerated upon mixing with phenol, a substrate for this system. Under steady-state conditions, hydrogen peroxide was generated in the absence of substrate. The oxidized hydroxylase also decomposed hydrogen peroxide to liberate dioxygen in the absence of reducing equivalents. This activity suggests that dioxygen activation may be reversible. The linear free energy relationship determined from hydroxylation of para-substituted phenols under steady-state turnover has a negative slope. A value of rho < 0 is consistent with electrophilic attack by the oxidizing intermediate on the aromatic substrates. The results from these steady and pre-steady-state experiments provide compelling evidence that the diiron(III) intermediate is the active oxidant in the toluene/o-xylene monooxygenase system and is a peroxodiiron(III) transient, despite differences between its optical and Mössbauer spectroscopic parameters and those of other peroxodiiron(III) centers.
Figures
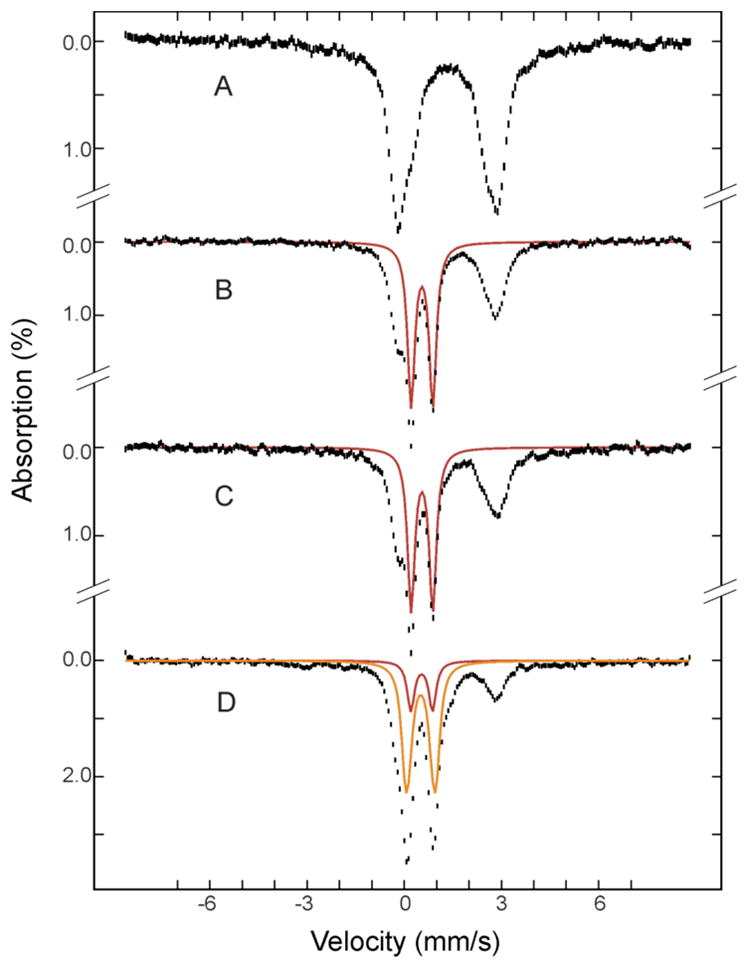
 ) reacts with dioxygen at ~ 26 s−1 to form a diiron(III) transient species (
 ). Only ~45% of diiron(II) clusters give rise to this intermediate. The diiron(III) transient subsequently decays to the oxidized resting state (
 ) at ~ 0.045 s−1. The unreacted diiron(II) centers decay slowly at 0.02 s−1 to generate several ill-defined ferric species, the production of which is not depicted. Solid lines are one- or two-exponential fits to the data.
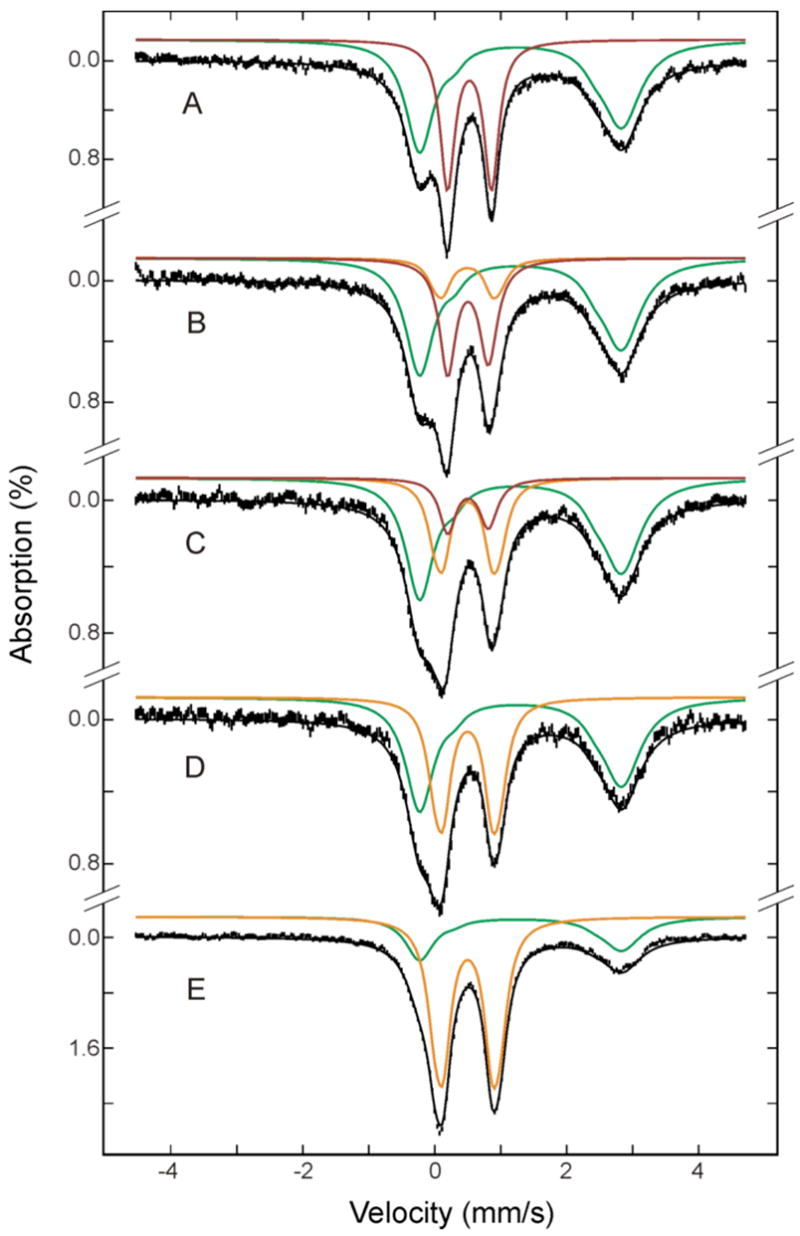
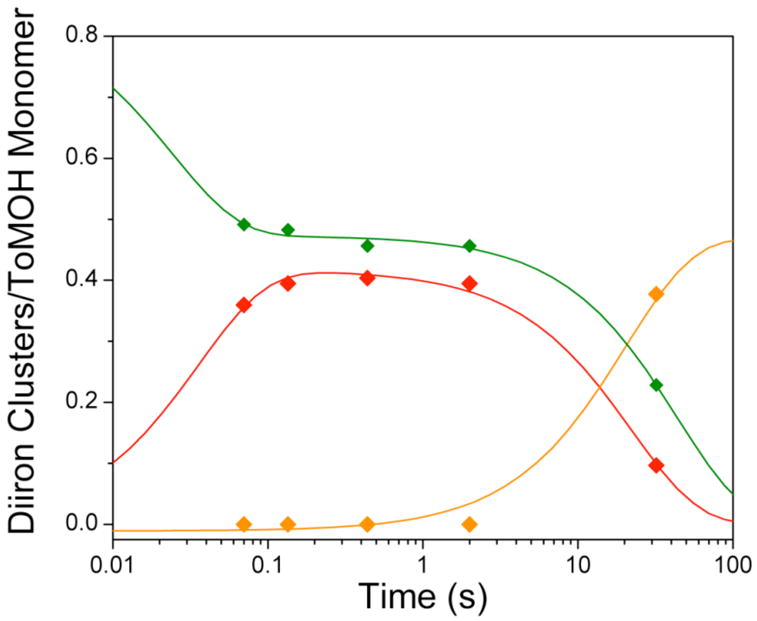
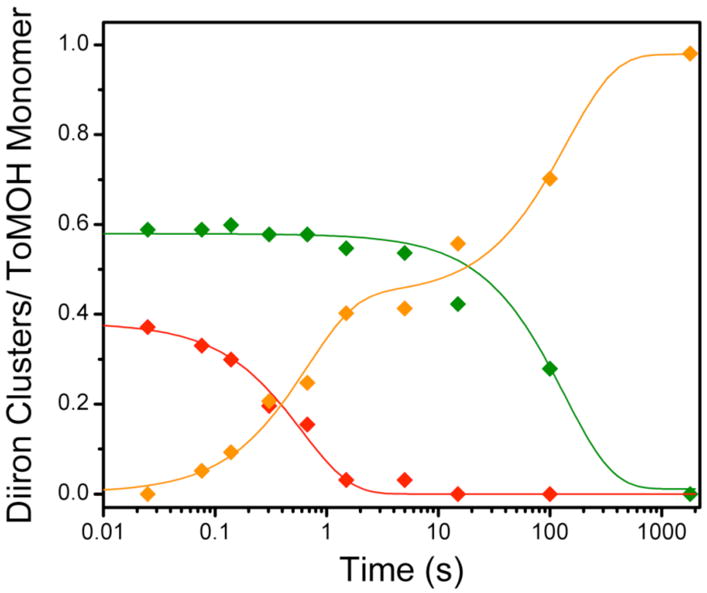 ) decays at 2 s−1 to give rise to the early formation phase of diiron(III) product (
). Diiron(II) clusters (
) that do not traverse the intermediate oxidize more slowly, with a rate constant of ~0.01 s−1 to product. Solid lines represent one- or two-exponential fits to the data.
) decays at 2 s−1 to give rise to the early formation phase of diiron(III) product (
). Diiron(II) clusters (
) that do not traverse the intermediate oxidize more slowly, with a rate constant of ~0.01 s−1 to product. Solid lines represent one- or two-exponential fits to the data.
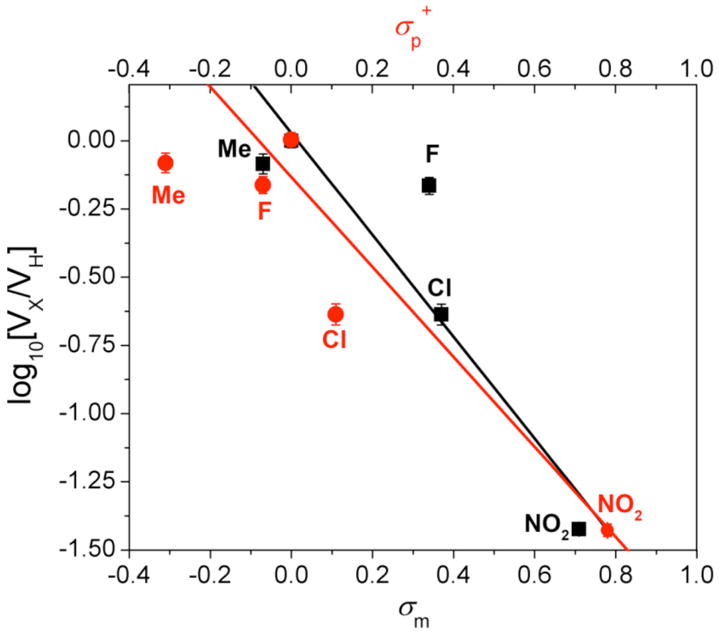
 ) respectively. A negative reaction constant is indicative of electrophilic reactions. The goodness of fit as measured by R2 for either σ value is 0.81.
Similar articles
-
Characterization of a peroxodiiron(III) intermediate in the T201S variant of toluene/o-xylene monooxygenase hydroxylase from Pseudomonas sp. OX1.J Am Chem Soc. 2009 May 6;131(17):6074-5. doi: 10.1021/ja9011782. J Am Chem Soc. 2009. PMID: 19354250 Free PMC article.
-
Dioxygen activation at non-heme diiron centers: oxidation of a proximal residue in the I100W variant of toluene/o-xylene monooxygenase hydroxylase.Biochemistry. 2007 Dec 25;46(51):14795-809. doi: 10.1021/bi7017128. Epub 2007 Nov 29. Biochemistry. 2007. PMID: 18044971 Free PMC article.
-
Active site threonine facilitates proton transfer during dioxygen activation at the diiron center of toluene/o-xylene monooxygenase hydroxylase.J Am Chem Soc. 2010 Oct 6;132(39):13582-5. doi: 10.1021/ja1063795. J Am Chem Soc. 2010. PMID: 20839885 Free PMC article.
-
Substrate trafficking and dioxygen activation in bacterial multicomponent monooxygenases.Acc Chem Res. 2007 Jul;40(7):466-74. doi: 10.1021/ar600040e. Epub 2007 May 23. Acc Chem Res. 2007. PMID: 17518435 Review.
-
Hydroxylation of C-H bonds at carboxylate-bridged diiron centres.Philos Trans A Math Phys Eng Sci. 2005 Apr 15;363(1829):861-77; discussion 1035-40. doi: 10.1098/rsta.2004.1532. Philos Trans A Math Phys Eng Sci. 2005. PMID: 15901540 Review.
Cited by
-
Characterization of a peroxodiiron(III) intermediate in the T201S variant of toluene/o-xylene monooxygenase hydroxylase from Pseudomonas sp. OX1.J Am Chem Soc. 2009 May 6;131(17):6074-5. doi: 10.1021/ja9011782. J Am Chem Soc. 2009. PMID: 19354250 Free PMC article.
-
Cyanobacterial alkane biosynthesis further expands the catalytic repertoire of the ferritin-like 'di-iron-carboxylate' proteins.Curr Opin Chem Biol. 2011 Apr;15(2):291-303. doi: 10.1016/j.cbpa.2011.02.019. Curr Opin Chem Biol. 2011. PMID: 21440485 Free PMC article. Review.
-
Substrate-Triggered μ-Peroxodiiron(III) Intermediate in the 4-Chloro-l-Lysine-Fragmenting Heme-Oxygenase-like Diiron Oxidase (HDO) BesC: Substrate Dissociation from, and C4 Targeting by, the Intermediate.Biochemistry. 2022 Apr 19;61(8):689-702. doi: 10.1021/acs.biochem.1c00774. Epub 2022 Apr 5. Biochemistry. 2022. PMID: 35380785 Free PMC article.
-
A Peroxodiiron(III/III) Intermediate Mediating Both N-Hydroxylation Steps in Biosynthesis of the N-Nitrosourea Pharmacophore of Streptozotocin by the Multi-domain Metalloenzyme SznF.J Am Chem Soc. 2020 Jul 8;142(27):11818-11828. doi: 10.1021/jacs.0c03431. Epub 2020 Jun 24. J Am Chem Soc. 2020. PMID: 32511919 Free PMC article.
-
Unprecedented (μ-1,1-Peroxo)diferric Structure for the Ambiphilic Orange Peroxo Intermediate of the Nonheme N-Oxygenase CmlI.J Am Chem Soc. 2017 Aug 2;139(30):10472-10485. doi: 10.1021/jacs.7b05389. Epub 2017 Jul 19. J Am Chem Soc. 2017. PMID: 28673082 Free PMC article.
References
Publication types
MeSH terms
Substances
Grants and funding
LinkOut - more resources
Full Text Sources
