. 2007 Oct;3(10):1951-67.
doi: 10.1371/journal.pcbi.0030196. Epub 2007 Aug 24.

Alternative splicing events identified in human embryonic stem cells and neural progenitors

Affiliations

Alternative splicing events identified in human embryonic stem cells and neural progenitors

Gene W Yeo et al. PLoS Comput Biol. 2007 Oct.

Abstract

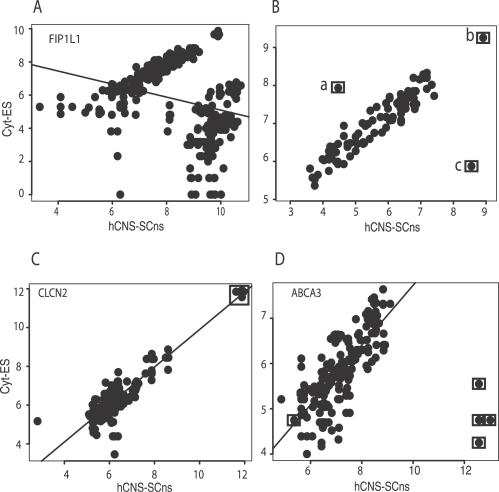
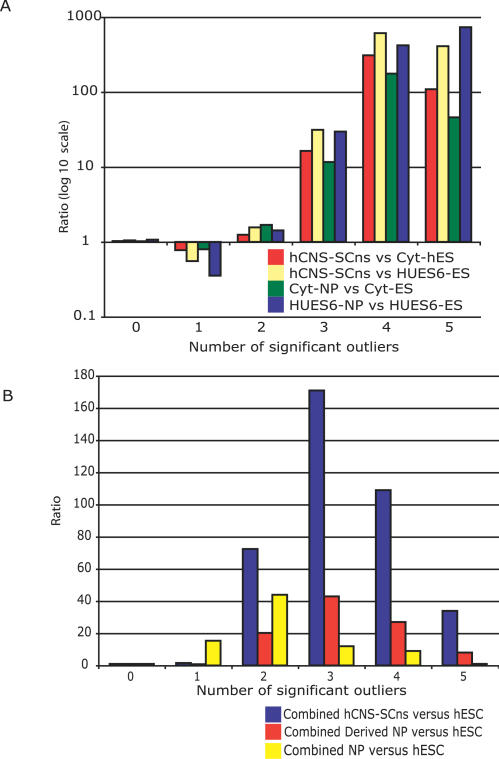
Human embryonic stem cells (hESCs) and neural progenitor (NP) cells are excellent models for recapitulating early neuronal development in vitro, and are key to establishing strategies for the treatment of degenerative disorders. While much effort had been undertaken to analyze transcriptional and epigenetic differences during the transition of hESC to NP, very little work has been performed to understand post-transcriptional changes during neuronal differentiation. Alternative RNA splicing (AS), a major form of post-transcriptional gene regulation, is important in mammalian development and neuronal function. Human ESC, hESC-derived NP, and human central nervous system stem cells were compared using Affymetrix exon arrays. We introduced an outlier detection approach, REAP (Regression-based Exon Array Protocol), to identify 1,737 internal exons that are predicted to undergo AS in NP compared to hESC. Experimental validation of REAP-predicted AS events indicated a threshold-dependent sensitivity ranging from 56% to 69%, at a specificity of 77% to 96%. REAP predictions significantly overlapped sets of alternative events identified using expressed sequence tags and evolutionarily conserved AS events. Our results also reveal that focusing on differentially expressed genes between hESC and NP will overlook 14% of potential AS genes. In addition, we found that REAP predictions are enriched in genes encoding serine/threonine kinase and helicase activities. An example is a REAP-predicted alternative exon in the SLK (serine/threonine kinase 2) gene that is differentially included in hESC, but skipped in NP as well as in other differentiated tissues. Lastly, comparative sequence analysis revealed conserved intronic cis-regulatory elements such as the FOX1/2 binding site GCAUG as being proximal to candidate AS exons, suggesting that FOX1/2 may participate in the regulation of AS in NP and hESC. In summary, a new methodology for exon array analysis was introduced, leading to new insights into the complexity of AS in human embryonic stem cells and their transition to neural stem cells.


Conflict of interest statement

Competing interests. The authors have declared that no competing interests exist.

Figures

Figure 1
Figure 1. Molecular Characterization of Human Embryonic Stem Cell Lines and Neuronal Progenitors
(A) Immunohistochemical analysis of markers in NPs derived from the hESC lines (Cyt-NP from Cyt-ES; and HUES6-NP from HUES6-ES) and in hCNS-SCns. Cyt-NP, HUES6-NP, and hCNS-SCns cells were Nestin and Sox1 positive. Nuclei stained positive for Dapi. White horizontal bar indicated 15 μm. (B) Gene-level signal estimates of marker genes (GAPDH, Oct4, Nanog, Nestin, Notch1, DNER, and Sox1) from Affymetrix exon array analysis. Vertical bars indicated average log2 normalized signal estimates, and error bars represented standard deviations from three independent replicate experiments per cell type. (C) RT-PCR of marker genes (GAPDH, Oct4, Nanog, Nestin, Notch1, DNER, and Sox1).
Figure 2
Figure 2. Gene Ontology Analysis
Differential gene expression of hESCs (Cyt-ES and HUES6-ES) and NPs (Cyt-NP, HUES6-NP, and hCNS-SCns) was computed from gene-level signal estimates. Statistical significance for differential gene expression was determined by using t-statistics with Benjamini-Hochberg correction for false discovery rate (p < 0.01). Gene Ontology “molecular function,” “cellular component,” and “biological process” categories, which differed significantly (p < 0.05) in the representation between significantly enriched genes (black bars) and all other genes (white bars), were shown. Statistical significance for GO analysis was assessed by using χ2 statistics with Bonferroni correction for multiple hypothesis testing. GO categories are ordered from top to bottom in order of decreasingly significant bias toward enriched genes. (A) GO analysis of enriched genes in hESCs. (B) GO analysis of enriched genes in NPs.
Figure 3
Figure 3. Description of the REAP Algorithm Comparing Exon Array Signal Estimates from hCNS-SCns and Cyt-ES
(A) Histogram of Pearson correlation coefficients computed from median signal estimates for probesets between Cyt-ES versus hCNS-SCns for genes (blue bars). Genes were required to have more than five probesets localized within the exons in the gene. Red bars represented Pearson correlation coefficients computed from exons with shuffled signal estimates. (B) Each probeset contained probeset-level estimates from three replicates each, (a, b, c) in Cyt-ES and (d, e, f) in hCNS-SCns. The five points summarizing the log2 probeset-level estimates are indicated by black filled circles. (C) Each probeset was summarized by five points. Scatter plots of signal estimates for probesets that were present in at least one cell type (Cyt-ES or hCNS-SCns) for the EHBP1 gene. Probesets were considered present if the DABG p-value was <0.05 for all three replicates in the cell type. A regression line derived from robust linear regression with MM estimation is indicated. Points above the line represent probesets within exons that were enriched in Cyt-ES and points below represent exons that were enriched in hCNS-SCns. Points close to the regression line are not significantly different in Cyt-ES versus hCNS-SCns. Boxed points represented the five-point summary of a probeset that was significantly enriched in Cyt-ES but was skipped in hCNS-SCns. (D) Histogram of studentized residuals for points from the scatter plot in (C) in EHBP1. (E) The histogram of studentized residuals for all points for all analyzed probesets (100 bins). (F) The scatter plot of studentized residuals generated from comparing Cyt-ES versus hCNS-SCns and hCNS-SCns versus Cyt-ES of 5,000 randomly chosen probesets.
Figure 4
Figure 4. Sources of False Positives
(A) Scatter plot of points for the FIP1L1 gene and the line representing the robust regression estimate. (B) Boxed point “a” represents a significant “outlier” (with a significantly different studentized residual and low leverage). Boxed point “b” represents a “high leverage” point (low studentized residual and a high leverage). Boxed point “c” represents a “high influence” point (high studentized residual, high leverage, and high influence). (C) Scatter plot of points for the CLCN2 gene. Boxed points represent “high leverage” points. (D) Scatter plot of points for the ABCA3 gene. Boxed points represent “high influence” points.
Figure 5
Figure 5. Correlation between “Outliers”
(A) The number of probesets with N significant “outliers” was determined for hCNS-SCns versus Cyt-ES, hCNS-SCns versus HUES6-ES, Cyt-NPs versus Cyt-ES, and HUES6-NPs versus HUES6-ES (N = 0, 1, 2, 3, 4, 5). For comparison, points to probeset relationships were randomly permuted, retaining the same number of “outliers.” Vertical bars represent the ratio between the number of actual points and the randomly permutated sets. (B) Similar to (A), except points were counted as “outliers” only if they were “outliers” in both hCNS-SCns versus Cyt-ES and hCNS-SCns versus HUES6-ES (combined hCNS-SCns versus hESC; blue bars); in both HUES6-NP versus HUES6-ES and Cyt-NP versus Cyt-ES (combined derived NP versus hESC; red bars); and in all four comparisons (combined NP versus hESC; yellow bar).
Figure 6
Figure 6. Comparison of REAP Predictions for hCNS-SCns versus Cyt-hES, hCNS-SCns versus HUES6-ES, Cyt-NP versus Cyt-ES, and HUES6-NPs versus HUES6-ES with Alternative Exons Identified by an EST-Based Method and ACEScan
(A) Black-filled squares represented the fraction of exons containing probesets with N significant points that had EST evidence for exon inclusion or exclusion (N = 0, 1, 2, 3, 4 and 5). White-filled triangles represented similarly computed fractions with permuted probeset to exon mappings. (B) Black-filled squares represented the fraction of exons containing probesets with N significant points that had ACEScan positive scores, indicative of evolutionarily conserved alternative exons. White-filled triangles represented similarly computed fractions with permuted probeset to exon mappings.
Figure 7
Figure 7. RT-PCR Validation of REAP-Predicted Alternative Exons
(A) Probesets (exons) were considered REAP[+] candidates if they contained at least N = 2 (white bars), 3 (gray bars), or 4 (black bars) significant outliers. True positive (TP), true negative (TN), false positive (FP), and false negative (FN) rates were calculated from RT-PCR-validated REAP[+] exons at the different cutoffs (N = 2, 3, 4). (B) Nine RT-PCR validated REAP[+] AS events in hESCs (Cyt-ES and HUES6-ES), derived NPs (Cyt-NP and HUES6-NP), and hCNS-SCns. Arrows indicate the larger (exon-included) isoforms and smaller (exon-skipped) isoforms. (C) RT-PCR of REAP[+] alternative exons from EHBP1, SLK, and RAI14 across a panel of human tissues. Arrows indicate the larger (exon-included) isoforms and smaller (exon-skipped) isoforms.
Figure 8
Figure 8. Analysis of REAP[+] Genes Relative to Transcriptional Differences
(A) Histogam of t-statistics computed from gene-level signal estimates measuring the enrichment of genes in hESC and in NP. Genes on the right of the vertical line at 5 were designated enriched in hESC and genes on the left of the vertical line at −5 were designated enriched in NP; genes in between −5 and 5 were designated as “unchanged” or expressed similarly in hESC and NP. (B) Vertical bars representing the percentage of REAP[+] genes out of all genes in the different classifications (dashed bar: “enriched in hESC”; black filled bar: “unchanged”; white filled bar: “enriched in NP”), at different cutoffs of 1 to 5. (C) Set of genes where REAP[+] designation was randomly chosen. Similar representation as in (B).
Figure 9
Figure 9. Conserved Intronic cis-Elements Enriched Proximal to REAP[+] Alternative Exons
(A) Schematic describing the enumeration of intronic elements across 400 bases of flanking mammalian introns (human, dog, rat, and mouse). Red and green horizontal bars represent conserved intronic elements and nonconserved elements, respectively. Internal exons were divided into REAP[+]NP, REAP[+]ES, and REAP[−] exons. The χ statistic was computed to represent the enrichment of conserved elements in intronic regions flanking REAP[+]NP versus REAP[−] exons (x-axis), and REAP[+]ES versus REAP[−] exons (y-axis). The sign represented the direction of change, i.e., positive if enriched in introns flanking REAP[+] versus REAP[−] exon. Each conserved 5-mer was associated with two numbers: the enrichment in introns proximal to REAP[+]NP versus REAP[−] exons (x-axis), and REAP[+]ES versus REAP[−] exons (y-axis). (B) Downstream intronic regions, where the association between REAP[+] designation and the exons was shuffled. (C) Upstream intronic regions. Circled 5-mers in the upper right quadrant represent conserved 5-mers enriched in the upstream intronic regions of REAP[+]NP and REAP[+]ES exons. (D) Downstream intronic regions. Circled 5-mers in the upper right quadrant represent conserved 5-mers enriched in the downstream intronic regions of REAP[+]NP and REAP[+]ES exons.

References

    1. Muotri AR, Chu VT, Marchetto MC, Deng W, Moran JV, et al. Somatic mosaicism in neuronal precursor cells mediated by L1 retrotransposition. Nature. 2005;435:903–910. - PubMed
    1. Muotri AR, Gage FH. Generation of neuronal variability and complexity. Nature. 2006;441:1087–1093. - PubMed
    1. Thomson JA, Itskovitz-Eldor J, Shapiro SS, Waknitz MA, Swiergiel JJ, et al. Embryonic stem cell lines derived from human blastocysts. Science. 1998;282:1145–1147. - PubMed
    1. Keller G. Embryonic stem cell differentiation: emergence of a new era in biology and medicine. Genes Dev. 2005;19:1129–1155. - PubMed
    1. Sonntag KC, Simantov R, Isacson O. Stem cells may reshape the prospect of Parkinson's disease therapy. Brain Res Mol Brain Res. 2005;134:34–51. - PubMed

Publication types