

Emergence of recombinant forms of HIV: dynamics and scaling
- PMID: 17967052
- PMCID: PMC2041978
- DOI: 10.1371/journal.pcbi.0030205
Emergence of recombinant forms of HIV: dynamics and scaling
Abstract
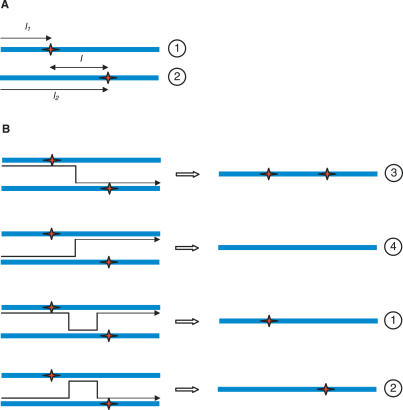
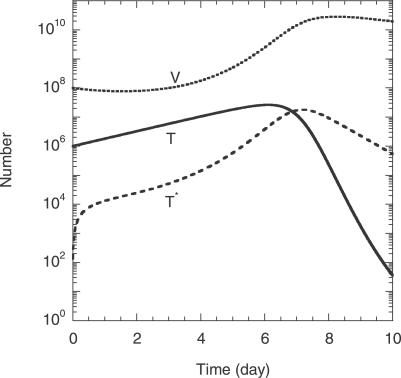
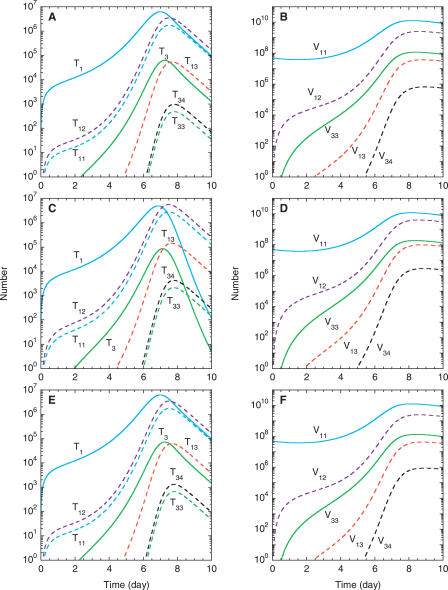
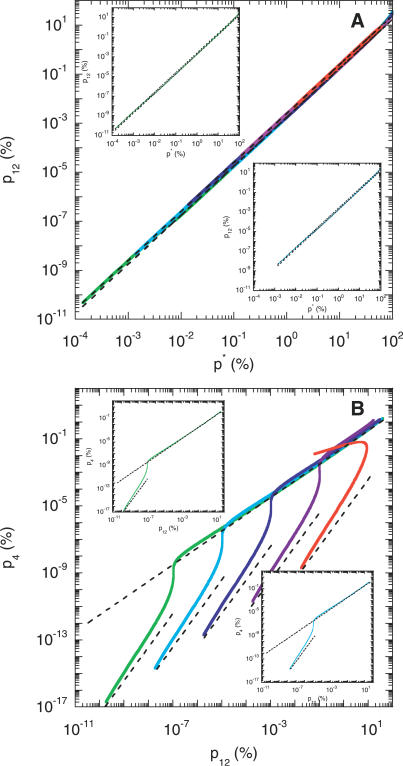
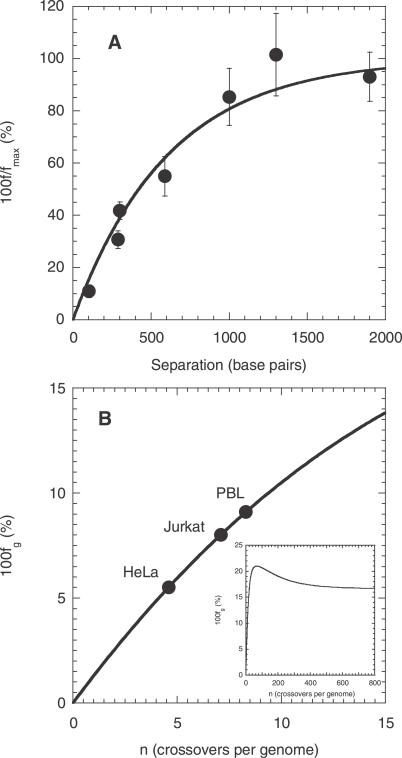
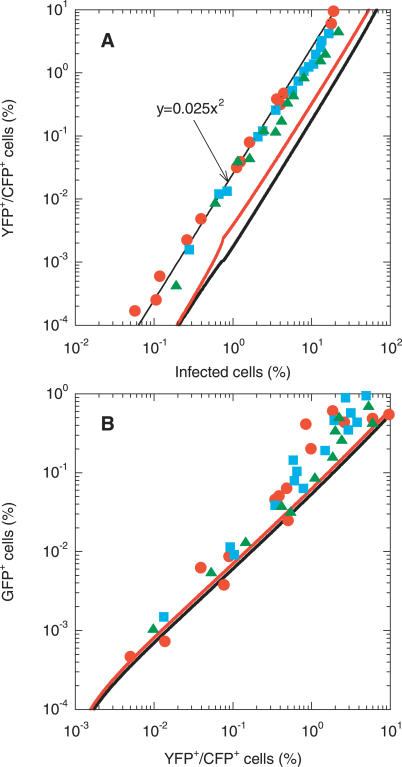
The ability to accelerate the accumulation of favorable combinations of mutations renders recombination a potent force underlying the emergence of forms of HIV that escape multi-drug therapy and specific host immune responses. We present a mathematical model that describes the dynamics of the emergence of recombinant forms of HIV following infection with diverse viral genomes. Mimicking recent in vitro experiments, we consider target cells simultaneously exposed to two distinct, homozygous viral populations and construct dynamical equations that predict the time evolution of populations of uninfected, singly infected, and doubly infected cells, and homozygous, heterozygous, and recombinant viruses. Model predictions capture several recent experimental observations quantitatively and provide insights into the role of recombination in HIV dynamics. From analyses of data from single-round infection experiments with our description of the probability with which recombination accumulates distinct mutations present on the two genomic strands in a virion, we estimate that approximately 8 recombinational strand transfer events occur on average (95% confidence interval: 6-10) during reverse transcription of HIV in T cells. Model predictions of virus and cell dynamics describe the time evolution and the relative prevalence of various infected cell subpopulations following the onset of infection observed experimentally. Remarkably, model predictions are in quantitative agreement with the experimental scaling relationship that the percentage of cells infected with recombinant genomes is proportional to the percentage of cells coinfected with the two genomes employed at the onset of infection. Our model thus presents an accurate description of the influence of recombination on HIV dynamics in vitro. When distinctions between different viral genomes are ignored, our model reduces to the standard model of viral dynamics, which successfully predicts viral load changes in HIV patients undergoing therapy. Our model may thus serve as a useful framework to predict the emergence of multi-drug-resistant forms of HIV in infected individuals.
Conflict of interest statement
Figures
Similar articles
-
Timing the emergence of resistance to anti-HIV drugs with large genetic barriers.PLoS Comput Biol. 2009 Mar;5(3):e1000305. doi: 10.1371/journal.pcbi.1000305. Epub 2009 Mar 13. PLoS Comput Biol. 2009. PMID: 19282958 Free PMC article.
-
HIV dynamics with multiple infections of target cells.Proc Natl Acad Sci U S A. 2005 Jun 7;102(23):8198-203. doi: 10.1073/pnas.0407498102. Epub 2005 May 31. Proc Natl Acad Sci U S A. 2005. PMID: 15928092 Free PMC article.
-
Recombination and drug resistance in HIV: population dynamics and stochasticity.Epidemics. 2009 Mar;1(1):58-69. doi: 10.1016/j.epidem.2008.11.001. Epub 2008 Dec 16. Epidemics. 2009. PMID: 21352751
-
Implications of recombination for HIV diversity.Virus Res. 2008 Jun;134(1-2):64-73. doi: 10.1016/j.virusres.2008.01.007. Epub 2008 Mar 4. Virus Res. 2008. PMID: 18308413 Review.
-
Study of the impact of HIV genotypic drug resistance testing on therapy efficacy.Verh K Acad Geneeskd Belg. 2001;63(5):447-73. Verh K Acad Geneeskd Belg. 2001. PMID: 11813503 Review.
Cited by
-
Modeling sequence evolution in HIV-1 infection with recombination.J Theor Biol. 2013 Jul 21;329:82-93. doi: 10.1016/j.jtbi.2013.03.026. Epub 2013 Apr 6. J Theor Biol. 2013. PMID: 23567647 Free PMC article.
-
Stochastic simulations suggest that HIV-1 survives close to its error threshold.PLoS Comput Biol. 2012;8(9):e1002684. doi: 10.1371/journal.pcbi.1002684. Epub 2012 Sep 13. PLoS Comput Biol. 2012. PMID: 23028282 Free PMC article.
-
Pre-existing resistance in the latent reservoir can compromise VRC01 therapy during chronic HIV-1 infection.PLoS Comput Biol. 2020 Nov 30;16(11):e1008434. doi: 10.1371/journal.pcbi.1008434. eCollection 2020 Nov. PLoS Comput Biol. 2020. PMID: 33253162 Free PMC article.
-
Antiviral capacity of the early CD8 T-cell response is predictive of natural control of SIV infection: Learning in vivo dynamics using ex vivo data.PLoS Comput Biol. 2024 Sep 10;20(9):e1012434. doi: 10.1371/journal.pcbi.1012434. eCollection 2024 Sep. PLoS Comput Biol. 2024. PMID: 39255323 Free PMC article.
-
Timing the emergence of resistance to anti-HIV drugs with large genetic barriers.PLoS Comput Biol. 2009 Mar;5(3):e1000305. doi: 10.1371/journal.pcbi.1000305. Epub 2009 Mar 13. PLoS Comput Biol. 2009. PMID: 19282958 Free PMC article.
References
-
- Blackard JT, Cohen DE, Mayer KH. Human immunodeficiency virus superinfection and recombination: Current state of knowledge and potential clinical consequences. Clin Infect Dis. 2002;34:1108–1114. - PubMed
Publication types
MeSH terms
Grants and funding
LinkOut - more resources
Full Text Sources
Medical
