

RNAi screen in Drosophila cells reveals the involvement of the Tom complex in Chlamydia infection
- PMID: 17967059
- PMCID: PMC2042019
- DOI: 10.1371/journal.ppat.0030155
RNAi screen in Drosophila cells reveals the involvement of the Tom complex in Chlamydia infection
Abstract
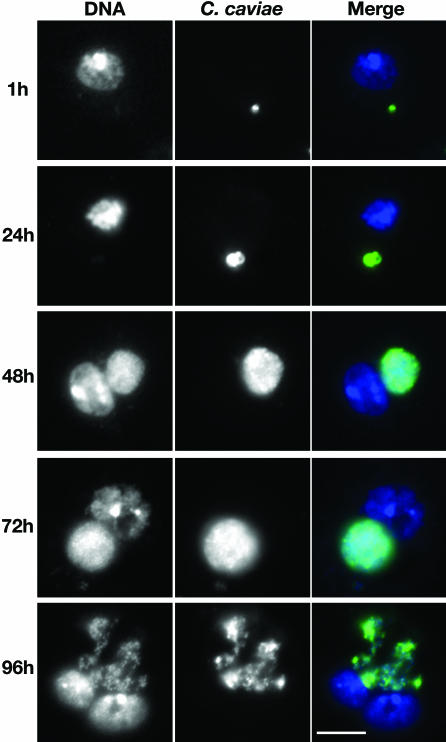
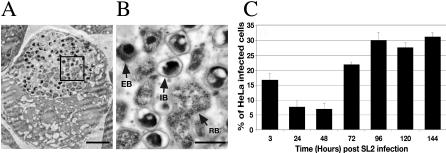
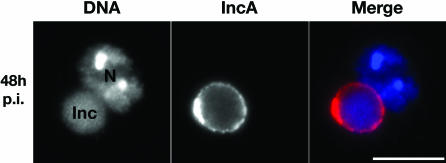
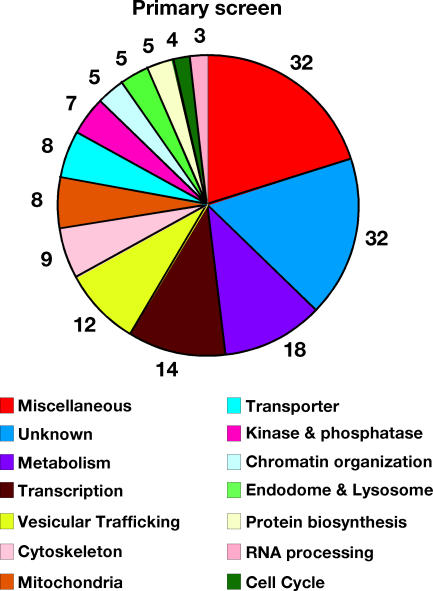
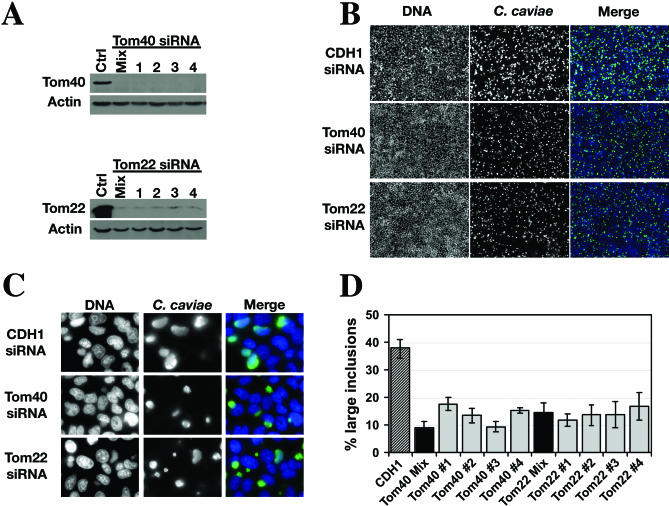
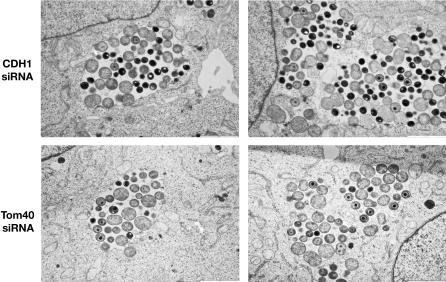
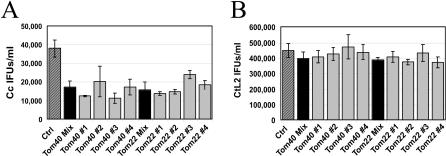
Chlamydia spp. are intracellular obligate bacterial pathogens that infect a wide range of host cells. Here, we show that C. caviae enters, replicates, and performs a complete developmental cycle in Drosophila SL2 cells. Using this model system, we have performed a genome-wide RNA interference screen and identified 54 factors that, when depleted, inhibit C. caviae infection. By testing the effect of each candidate's knock down on L. monocytogenes infection, we have identified 31 candidates presumably specific of C. caviae infection. We found factors expected to have an effect on Chlamydia infection, such as heparansulfate glycosaminoglycans and actin and microtubule remodeling factors. We also identified factors that were not previously described as involved in Chlamydia infection. For instance, we identified members of the Tim-Tom complex, a multiprotein complex involved in the recognition and import of nuclear-encoded proteins to the mitochondria, as required for C. caviae infection of Drosophila cells. Finally, we confirmed that depletion of either Tom40 or Tom22 also reduced C. caviae infection in mammalian cells. However, C. trachomatis infection was not affected, suggesting that the mechanism involved is C. caviae specific.
Conflict of interest statement
Figures

Similar articles
-
Differential signaling pathways are initiated in macrophages during infection depending on the intracellular fate of Chlamydia spp.Immunol Cell Biol. 2018 Mar;96(3):246-256. doi: 10.1111/imcb.1033. Epub 2018 Jan 6. Immunol Cell Biol. 2018. PMID: 29363185 Free PMC article.
-
Insertional mutagenesis in the zoonotic pathogen Chlamydia caviae.PLoS One. 2019 Nov 7;14(11):e0224324. doi: 10.1371/journal.pone.0224324. eCollection 2019. PLoS One. 2019. PMID: 31697687 Free PMC article.
-
Plasmid-cured Chlamydia caviae activates TLR2-dependent signaling and retains virulence in the guinea pig model of genital tract infection.PLoS One. 2012;7(1):e30747. doi: 10.1371/journal.pone.0030747. Epub 2012 Jan 24. PLoS One. 2012. PMID: 22292031 Free PMC article.
-
The chlamydial inclusion: escape from the endocytic pathway.Annu Rev Cell Dev Biol. 2002;18:221-45. doi: 10.1146/annurev.cellbio.18.012502.105845. Epub 2002 Apr 2. Annu Rev Cell Dev Biol. 2002. PMID: 12142274 Review.
-
Chlamydia trachomatis and its interaction with the cellular retromer.Int J Med Microbiol. 2018 Jan;308(1):197-205. doi: 10.1016/j.ijmm.2017.10.006. Epub 2017 Oct 26. Int J Med Microbiol. 2018. PMID: 29122514 Review.
Cited by
-
The Small Molecule H89 Inhibits Chlamydia Inclusion Growth and Production of Infectious Progeny.Infect Immun. 2021 Jun 16;89(7):e0072920. doi: 10.1128/IAI.00729-20. Epub 2021 Jun 16. Infect Immun. 2021. PMID: 33820812 Free PMC article.
-
A systemic network for Chlamydia pneumoniae entry into human cells.J Bacteriol. 2010 Jun;192(11):2809-15. doi: 10.1128/JB.01462-09. Epub 2010 Mar 16. J Bacteriol. 2010. PMID: 20233927 Free PMC article.
-
NK Cell-Mediated Processing Of Chlamydia psittaci Drives Potent Anti-Bacterial Th1 Immunity.Sci Rep. 2019 Mar 18;9(1):4799. doi: 10.1038/s41598-019-41264-4. Sci Rep. 2019. PMID: 30886314 Free PMC article.
-
Yersinia pestis Targets the Host Endosome Recycling Pathway during the Biogenesis of the Yersinia-Containing Vacuole To Avoid Killing by Macrophages.mBio. 2018 Feb 20;9(1):e01800-17. doi: 10.1128/mBio.01800-17. mBio. 2018. PMID: 29463656 Free PMC article.
-
The lipid transfer protein CERT interacts with the Chlamydia inclusion protein IncD and participates to ER-Chlamydia inclusion membrane contact sites.PLoS Pathog. 2011 Jun;7(6):e1002092. doi: 10.1371/journal.ppat.1002092. Epub 2011 Jun 23. PLoS Pathog. 2011. PMID: 21731489 Free PMC article.
References
-
- World Health Organization. Global prevalence and incidence of selected curable sexually transmitted infections: overview and estimates. WHO/HIV_AIDS/2001.02. Geneva: World Health Organization; 2001.
-
- Grayston JT. Background and current knowledge of Chlamydia pneumoniae and atherosclerosis. J Infect Dis. 2000;181(Suppl 3):S402–S410. - PubMed
-
- Itzhaki RF, Wozniak MA, Appelt DM, Balin BJ. Infiltration of the brain by pathogens causes Alzheimer's disease. Neurobiol Aging. 2004;25:619–627. - PubMed
-
- Gregory DW, Schaffner W. Psittacosis. Semin Respir Infect. 1997;12:7–11. - PubMed
Publication types
MeSH terms
Substances
Grants and funding
LinkOut - more resources
Full Text Sources
Other Literature Sources
Medical
Molecular Biology Databases
Miscellaneous
