. 2007 Oct 26;3(10):1530-9.
doi: 10.1371/journal.ppat.0030159.

Small-molecule inhibition of HIV pre-mRNA splicing as a novel antiretroviral therapy to overcome drug resistance

Affiliations

Small-molecule inhibition of HIV pre-mRNA splicing as a novel antiretroviral therapy to overcome drug resistance

Nadia Bakkour et al. PLoS Pathog. .

Abstract

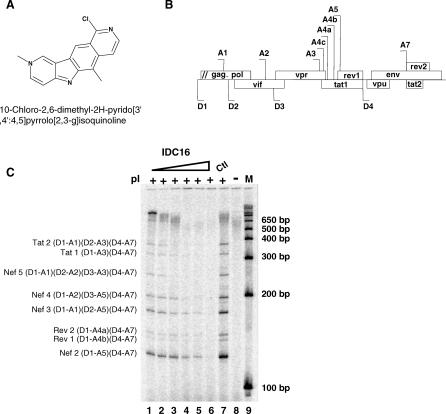
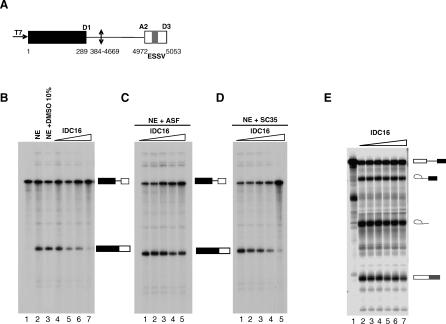
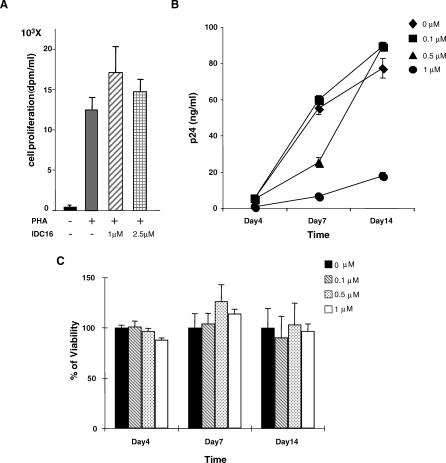
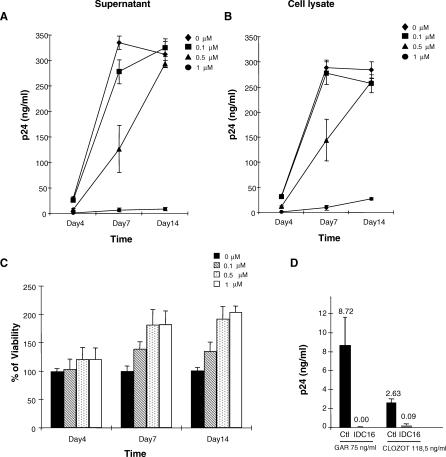
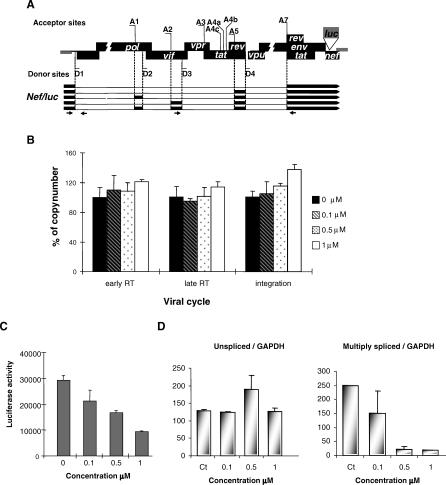
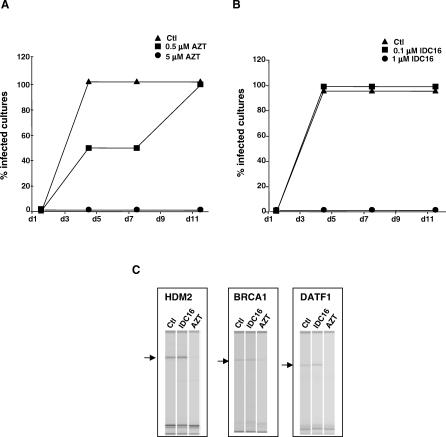
The development of multidrug-resistant viruses compromises antiretroviral therapy efficacy and limits therapeutic options. Therefore, it is an ongoing task to identify new targets for antiretroviral therapy and to develop new drugs. Here, we show that an indole derivative (IDC16) that interferes with exonic splicing enhancer activity of the SR protein splicing factor SF2/ASF suppresses the production of key viral proteins, thereby compromising subsequent synthesis of full-length HIV-1 pre-mRNA and assembly of infectious particles. IDC16 inhibits replication of macrophage- and T cell-tropic laboratory strains, clinical isolates, and strains with high-level resistance to inhibitors of viral protease and reverse transcriptase. Importantly, drug treatment of primary blood cells did not alter splicing profiles of endogenous genes involved in cell cycle transition and apoptosis. Thus, human splicing factors represent novel and promising drug targets for the development of antiretroviral therapies, particularly for the inhibition of multidrug-resistant viruses.


Conflict of interest statement

Competing interests. The authors have declared that no competing interests exist.

Figures

Figure 1
Figure 1. Selective Inhibition of HIV-1 RNA Splicing Ex Vivo by IDC16
(A) Drawing and formula of IDC16 compound. (B) Schematic representation of HIV-1 genome. The 5′ splice sites (D1–D4) and 3′ splice sites (A1–A7) are indicated. The various open reading frames are boxed. (C) HeLa cells transfected with the pΔPSP construct were either untreated (lane 7) or treated with 0.05 μM, 0.1 μM, 0.5 μM, 1 μM, 2.5 μM, or 5 μM of compound IDC16 (lanes 1–6, respectively). Multiply spliced products of HIV-1 RNA were amplified by RT-PCR using the oligonucleotide primers BSS and SJ4.7A. The PCR products were analyzed by polyacrylamide gel electrophoresis after normalization with GAPDH (see Materials and Methods). Nomenclature of the RT-PCR products on the left of the panel is according to [30]. Size markers (in bp) are shown on the right of the panel (lane 9). RT-PCR from untransfected HeLa cells (lane 8).
Figure 2
Figure 2. In Vitro Inhibition of HIV1-D1-A2 pre-mRNA Splicing by IDC16 and Complementation with SR Proteins SC35 and SF2/ASF
(A) Schematic representation of HIV1-D1-A2 transcript is shown. Numbering of the HIV-1/BRU RNA sequences is according to Ratner et al. [49]. (B) Polyacrylamide gel electrophoresis of the in vitro splicing products of HIV1-D1-A2 transcript. Uniformly labeled RNA was prepared as described under Materials and Methods and was incubated alone (lane 1) in a HeLa cell nuclear extract under splicing conditions in the absence (lane 2), in the presence of 10% DMSO (lane 3), or 5 μM, 10 μM, 20 μM, and 40 μM of compound IDC16 (lanes 4–7, respectively). (C) The same reactions as in (B) lanes 3–7 were complemented with 0.21 μM of recombinant SF2/ASF (lanes 1–5, respectively). (D) The same reactions as in (B) lanes 3–7 were complemented with 0.19 μM of recombinant SC35 (lanes 1–5, respectively). (E) Splicing products of the Minx transcript analyzed by polyacrylamide gel electrophoresis. Uniformly labeled RNA was incubated alone (lane 1), in HeLa nuclear extract in the absence (lane 2) or presence of 5 μM, 10 μM, 20 μM, 30 μM, or 50 μM of compound IDC16 (lanes 3–7), respectively.
Figure 3
Figure 3. Inhibition of HIV-1 Production in PBMC-Infected Cells by IDC16
(A) PBMCs from healthy donors were cultured in the presence of labeled 3H-thymidine and incorporated radioactivity was measured after 72 h stimulation with phytohemagglutinin A (PHA) in the absence (-) or presence of 1 μM or 2.5 μM of IDC16. (B) 100 TCID50 of Ada-M was used to infect triplicate of 106 activated PBMCs (stimulated for 2 d with PHA and IL2) in the absence or presence of 0.1 μM, 0.5 μM, or 1 μM of IDC16. Supernatant was harvested at the indicated days and viral capsid protein p24 antigen was quantitated using standard ELISA protocol. (C) Concurrently, cell viability was measured by trypan blue exclusion and indicated as percentage as compared with untreated cells.
Figure 4
Figure 4. Inhibition of HIV-1 Production in Macrophage-Infected Cells by IDC16
Macrophages were infected with 100 TCID50 of Ada-M for 18 h in the absence or presence of 0.1 μM, 0.5 μM, or 1 μM concentrations of IDC16 and then washed intensively with PBS. (A and B) The culture medium and cells were collected at days 4, 7, and 14, and extracellular (A) or intracellular (B) viral production was measured by the quantification of viral capsid protein p24 using ELISA. (C) Concurrently, cell viability was measured by trypan blue exclusion and indicated as percentage as compared with untreated cells. (D) Activated PBMCs from healthy donors were infected with two HIV-1 clinical isolates (GAR and CLO) in the absence (Ctl) or presence of 1 μM of IDC16 (1DC16). Supernatants were harvested after 14 d of infection days, and viral capsid protein p24 antigen was quantitated using standard ELISA protocol.
Figure 5
Figure 5. Identification of the Step in HIV Life Cycle Inhibited by IDC16
HOS-CD4+-CCR5+ cells were exposed to various concentrations of IDC16 and infected with Δenv-defective virions containing the luciferase gene (A). The efficiency of the reverse transcription and of the integration was evaluated by quantifying early and late reverse transcriptase products and the number of copies of integrated HIV DNA, respectively (B). Forty eight hours later, intracellular luciferase activity was measured as a marker of spliced viral RNA expression (C). The same infected cells treated with 0.1 μM, 0.5 μM, or 1 μM of IDC16 were used to examine the relative amount of unspliced precursor and multiply spliced HIV-1 RNA. Real-time RT-PCR was used to rigorously quantify the changes in unspliced (D, left panel) and multiply spliced (D, right panel) HIV-1 RNA levels after IDC16 treatment. The values are the average of two independent experiments and the level of expression is normalized with that of the internal control gene (GAPDH). The error bars indicate standard deviations. Arrows in (A) indicate the position of primers to amplify unspliced precursors (La 8.1 and La 9) and multiply spliced (P659 and P413MOD) HIV RNA species according to Brussel and Sonigo [48].
Figure 6
Figure 6. Comparison of HIV-1 Inhibition in MT2 Cells Treated with AZT or IDC16 and Analysis of Splicing Profiles of Apoptotic Genes in PBMC-Treated Cells
(A and B) MT2 cells cultured in a 96-well plate were infected with pNL4.3 at 100 TCID50 in the absence or presence of IDC16 (A) or AZT (B) for 18 h. Cells were then washed and changed to fresh medium with/without IDC16 or AZT. Half of the culture medium was refreshed each 2 or 4 d in the presence of drugs. The formation of syncytia was scored at the indicated time points. (C) Four ug of total RNA from triplicate of PBMCs untreated (lane Ctl) or treated with IDC16 (lane IDC16) or AZT (lane AZT), was reverse transcribed with Omniscript reverse transcriptase (QIAGEN) using random hexamers and oligo dT and. The mixture was aliquoted in a 96-well plate and subjected to PCR amplification using 0.375U/15 μl of hotStarTaq DNA Polymerase with specific primers (0.3–0.6 μM) using the buffer provided by the manufacturer (QIAGEN). The PCR reaction was carried out in a GeneAmp 9700 PCR system. Following an incubation of 15 min at 95 °C, and 35 cycles of 30 s at 94 °C, 30 s at 55 °C, and 1 min at 72 °C, the reaction was ended with an extension step of 10 min at 72 °C. PCR products were fractionated on a LabChip HT DNA assay station (Caliper) for quantitation and sizing. The full data can be accessed through http://www.lgfus.ca/Tazi/, username = Tazi, password = sc35. Three examples of genes altered by AZT treatment (HDM2), (BRCA1), and (DATF1) are shown.

Similar articles

Cited by

References

    1. Geretti AM. Clinical implications of HIV drug resistance to nucleoside and nucleotide reverse transcriptase inhibitors. AIDS Rev. 2006;8:210–220. - PubMed
    1. Del Rio C. Current concepts in antiretroviral therapy failure. Top HIV Med. 2006;14:102–106. - PubMed
    1. Barbaro G, Scozzafava A, Mastrolorenzo A, Supuran CT. Highly active antiretroviral therapy: current state of the art, new agents and their pharmacological interactions useful for improving therapeutic outcome. Curr Pharm Des. 2005;11:1805–1843. - PubMed
    1. Kijak GH, Currier JR, Tovanabutra S, Cox JH, Michael NL, et al. Lost in translation: implications of HIV-1 codon usage for immune escape and drug resistance. AIDS Rev. 2004;6:54–60. - PubMed
    1. Deeks SG. Antiretroviral treatment of HIV infected adults. BMJ. 2006;332:1489. - PMC - PubMed

Publication types

MeSH terms