. 2007 Oct;3(10):2023-36.
doi: 10.1371/journal.pgen.0030181. Epub 2007 Sep 10.

Genome-wide profiling of DNA methylation reveals a class of normally methylated CpG island promoters

Affiliations

Genome-wide profiling of DNA methylation reveals a class of normally methylated CpG island promoters

Lanlan Shen et al. PLoS Genet. 2007 Oct.

Abstract

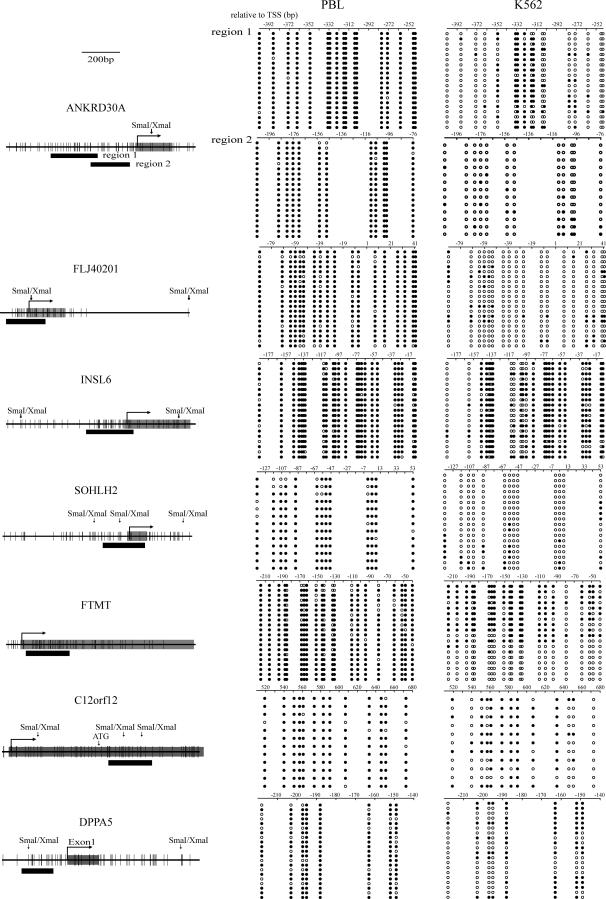
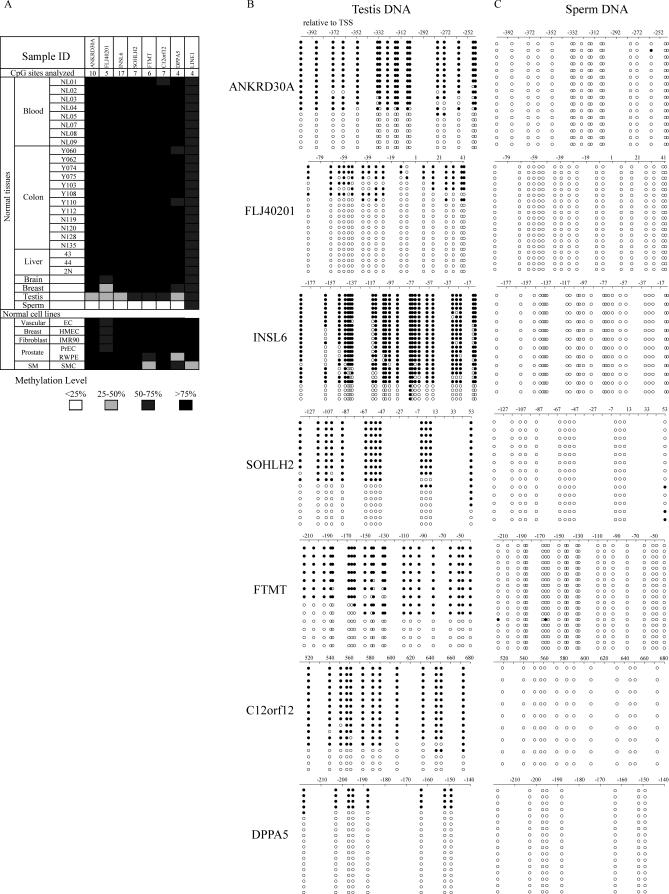
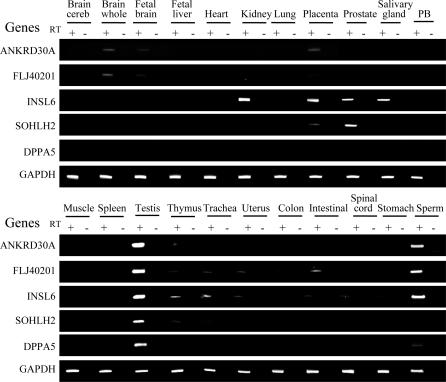
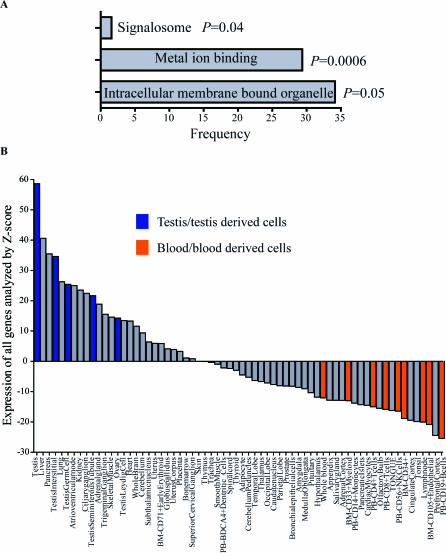
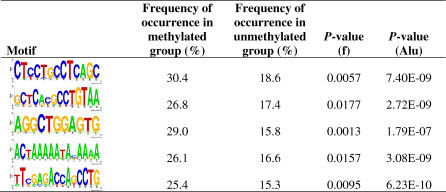
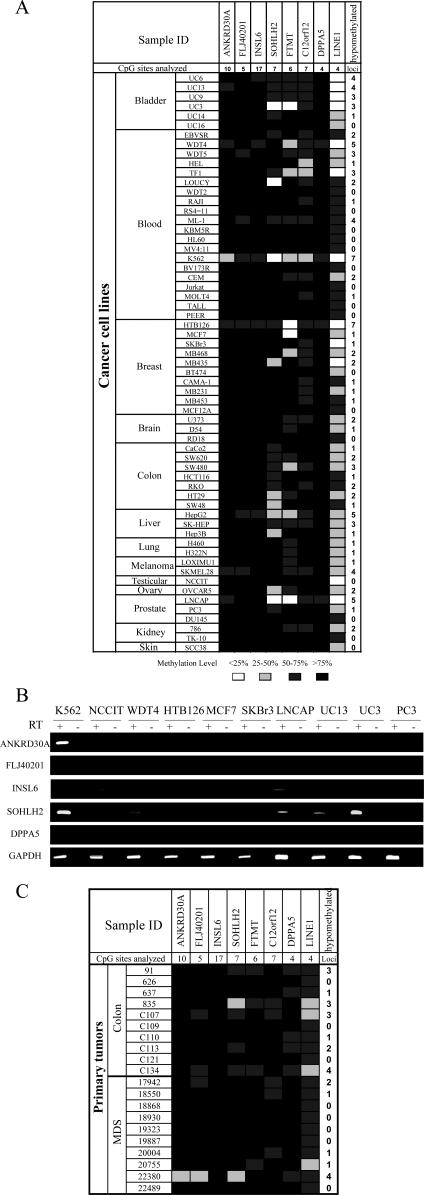
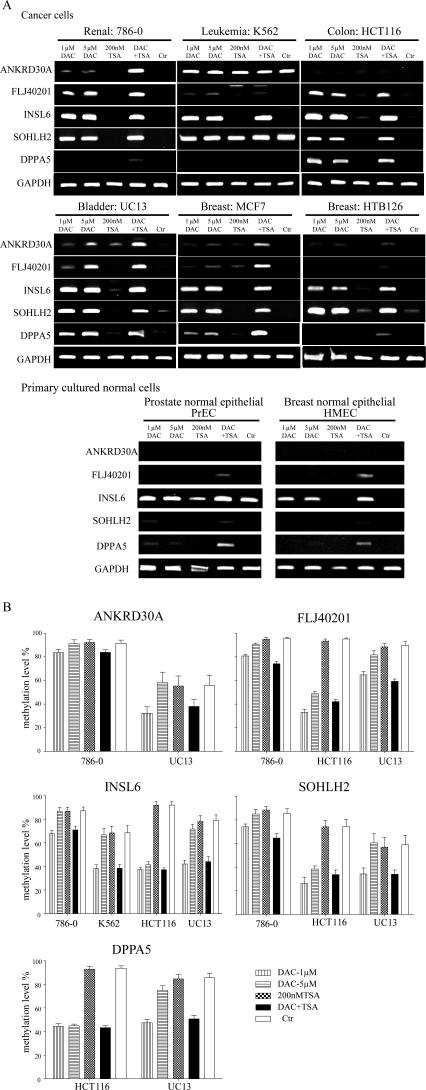
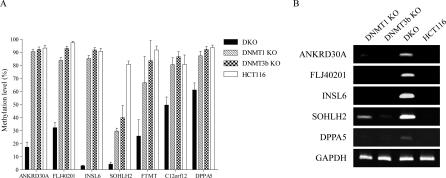
The role of CpG island methylation in normal development and cell differentiation is of keen interest, but remains poorly understood. We performed comprehensive DNA methylation profiling of promoter regions in normal peripheral blood by methylated CpG island amplification in combination with microarrays. This technique allowed us to simultaneously determine the methylation status of 6,177 genes, 92% of which include dense CpG islands. Among these 5,549 autosomal genes with dense CpG island promoters, we have identified 4.0% genes that are nearly completely methylated in normal blood, providing another exception to the general rule that CpG island methylation in normal tissue is limited to X inactivation and imprinted genes. We examined seven genes in detail, including ANKRD30A, FLJ40201, INSL6, SOHLH2, FTMT, C12orf12, and DPPA5. Dense promoter CpG island methylation and gene silencing were found in normal tissues studied except testis and sperm. In both tissues, bisulfite cloning and sequencing identified cells carrying unmethylated alleles. Interestingly, hypomethylation of several genes was associated with gene activation in cancer. Furthermore, reactivation of silenced genes could be induced after treatment with a DNA demethylating agent or in a cell line lacking DNMT1 and/or DNMT3b. Sequence analysis identified five motifs significantly enriched in this class of genes, suggesting that cis-regulatory elements may facilitate preferential methylation at these promoter CpG islands. We have identified a group of non-X-linked bona fide promoter CpG islands that are densely methylated in normal somatic tissues, escape methylation in germline cells, and for which DNA methylation is a primary mechanism of tissue-specific gene silencing.


Conflict of interest statement

Competing interests. The authors have declared that no competing interests exist.

Figures

Figure 1
Figure 1. Bisulfite Sequencing of Seven CGI Promoters in PBL and K562
For each gene, a diagram of the CGI promoter is shown on the left. Each vertical line represents a single CpG site. The transcription start site, location of exon 1 and restriction enzyme sites are shown on the top. Thick bars indicate the location of regions analyzed by bisulfite-sequencing. Bisulfite sequencing results are shown on the right. Each row represents an individual cloned allele. Circles represent CpG sites and their spacing accurately reflects the CpG density of the region. Black circles, methylated CpG site; white circles, unmethylated CpG site. Dense methylation at the CGI promoters was found in PBLs. In contrast, promoter hypomethylation for all genes was found in K562.
Figure 2
Figure 2. DNA Methylation Analyses in a Panel of Normal Tissues
(A) Methylation profiling in normal tissues by bisulfite-pyrosequencing. Promoter methylation of seven identified genes and global methylation by LINE1 methylation were examined in normal tissues (top) and primary cultured normal cells (bottom). Number of CpG sites analyzed for each gene is indicated in the second row. Methylation level is scored into four scales: Filled black boxes, methylation level greater than 75%; filled dark grey boxes, methylation level from 50% to 75%; filled light grey boxes, methylation level from 25% to 50%, and open boxes, methylation level less than 25%. (B and C) Bisulfite sequencing in sperm (B) and testis (C) DNA identified cells carrying completely unmethylated alleles in all the genes analyzed.
Figure 3
Figure 3. Gene Expression by RT-PCR in a Normal Tissue Panel
Tissue types are indicated above the data. The name of each gene amplified is indicated on the left of each column. PCR was performed by using samples prepared with (RT+) or without (RT−) reverse transcriptase. GAPDH was amplified to show the integrity of the RNA.
Figure 4
Figure 4. GO Analysis and Tissue-Specific Expression Patterns for Dense-CGI Associated Autosomal Genes Methylated in PBLs
(A) GO analysis of this class of genes. Each bar represents the frequency of significant GO terms. (B) Gene expression pattern analysis (GNF database) for 127 genes analyzed by Z-score. The y-axis indicates the Z-score sum for all genes in a given sample. Each bar represents a normal tissue or cell type. Blue indicates testis or testis-derived cells, orange indicates blood or blood-derived cells, and gray indicates all other tissues/cell types.
Figure 5
Figure 5. Five Motifs Significantly Enriched in Genes with Methylated CGIs
The motifs are represented as sequence logos. The frequency of occurrence was calculated by the number of genes found to match the motif in each group/total number of genes in each group. p-Value (f) was calculated from Fisher exact test to test if the motif matches are significantly enriched in the methylated group compared to unmethylated group. p-Value (Alu) was calculated by using MAST to match the motif to Alu consensus sequence.
Figure 6
Figure 6. DNA Methylation and Gene Expression Analyses in Cancers
(A) Profiles of promoter methylation of seven identified genes and global methylation in cancer cell lines by bisulfite pyrosequencing. (B) Gene expression analysis in selected cancer cell lines. (C) Methylation profiles in primary tumors.
Figure 7
Figure 7. Gene Expression and DNA Methylation Changes after Treatment with DAC or TSA
(A) Examples of RT-PCR results. The cell name and tissue type are indicated on the top. The name of each gene amplified is indicated on the left of each column. Cells were treated with 1 μM DAC, 5 μM DAC, 200 nM TSA, a combination of 1 μM DAC and 200 nM TSA (DAC+TSA) or no drug as a control (Ctr). (B) DNA methylation analysis in each promoter region after treatment. Reduced methylation level was detected after DAC and the combination of DAC and TSA treatment. By contrast, TSA did not affect the methylation of any gene.
Figure 8
Figure 8. Methylation and Gene Expression Analysis in DNMT Knock-Out Cells
(A) DNA methylation analyzed by bisulfite-pyrosequencing in DNA methyltransferase 1 and 3b double knockout (DKO), DNMT1 partial knockout (DNMT1 KO), DNMT3b knockout (DNMT3b KO), and parental HCT116 cells. (B) Gene expression by RT-PCR in HCT116 with and without DNMT knockout.

Similar articles

Cited by

References

    1. Bird AP. Cpg-rich islands and the function of DNA methylation. Nature. 1986;321:209–213. - PubMed
    1. Razin A, Cedar H. DNA methylation and genomic imprinting. Cell. 1994;77:473–476. - PubMed
    1. Jaenisch R, Bird A. Epigenetic regulation of gene expression: how the genome integrates intrinsic and environmental signals. Nat Genet. 2003;33:245–254. - PubMed
    1. Li E. Chromatin modification and epigenetic reprogramming in mammalian development. Nat Rev Genet. 2002;3:662–673. - PubMed
    1. Jones PA, Takai D. The role of DNA methylation in mammalian epigenetics. Science. 2001;293:1068–1070. - PubMed

Publication types

MeSH terms