

Using relative and absolute measures for monitoring health inequalities: experiences from cross-national analyses on maternal and child health
- PMID: 17967166
- PMCID: PMC2173893
- DOI: 10.1186/1475-9276-6-15
Using relative and absolute measures for monitoring health inequalities: experiences from cross-national analyses on maternal and child health
Abstract
Background: As reducing socio-economic inequalities in health is an important public health objective, monitoring of these inequalities is an important public health task. The specific inequality measure used can influence the conclusions drawn, and there is no consensus on which measure is most meaningful. The key issue raising most debate is whether to use relative or absolute inequality measures. Our paper aims to inform this debate and develop recommendations for monitoring health inequalities on the basis of empirical analyses for a broad range of developing countries.
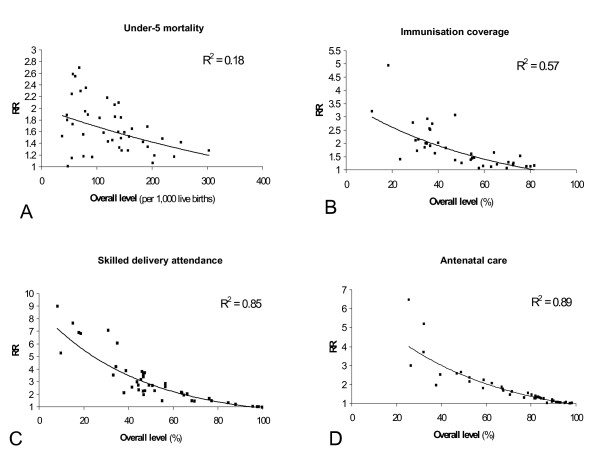
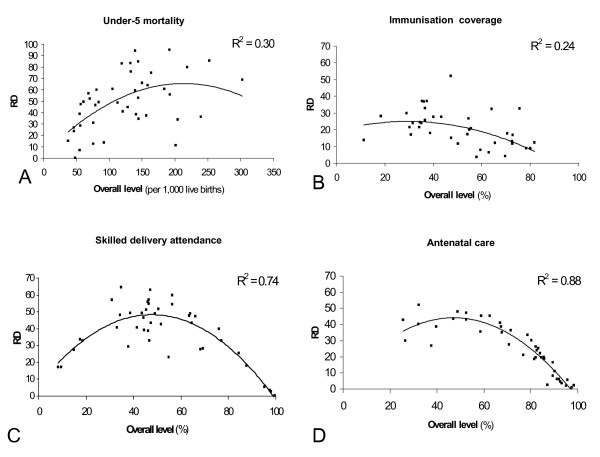
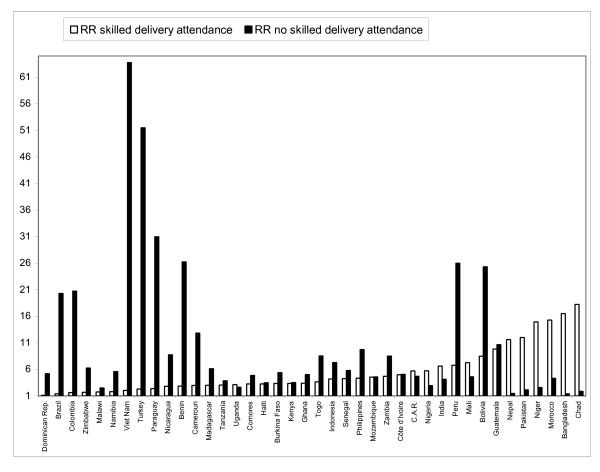
Methods: Wealth-group specific data on under-5 mortality, immunisation coverage, antenatal and delivery care for 43 countries were obtained from the Demographic and Health Surveys. These data were used to describe the association between the overall level of these outcomes on the one hand, and relative and absolute poor-rich inequalities in these outcomes on the other.
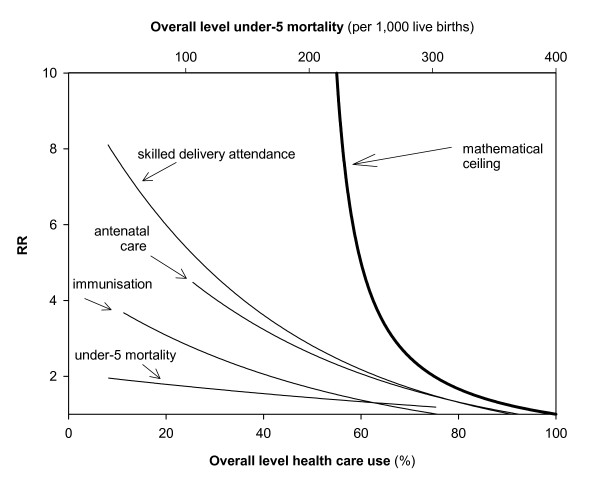
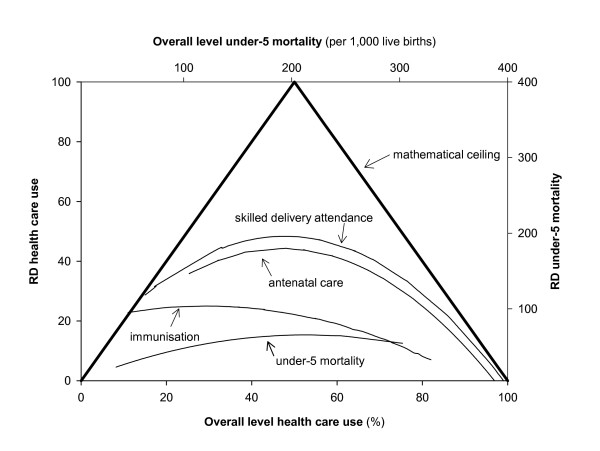
Results: We demonstrate that the values that the absolute and relative inequality measures can take are bound by mathematical ceilings. Yet, even where these ceilings do not play a role, the magnitude of inequality is correlated with the overall level of the outcome. The observed tendencies are, however, not necessities. There are countries with low mortality levels and low relative inequalities. Also absolute inequalities showed variation at most overall levels.
Conclusion: Our study shows that both absolute and relative inequality measures can be meaningful for monitoring inequalities, provided that the overall level of the outcome is taken into account. Suggestions are given on how to do this. In addition, our paper presents data that can be used for benchmarking of inequalities in the field of maternal and child health in low and middle-income countries.
Figures
Similar articles
-
Delivery channels and socioeconomic inequalities in coverage of reproductive, maternal, newborn, and child health interventions: analysis of 36 cross-sectional surveys in low-income and middle-income countries.Lancet Glob Health. 2021 Aug;9(8):e1101-e1109. doi: 10.1016/S2214-109X(21)00204-7. Epub 2021 May 26. Lancet Glob Health. 2021. PMID: 34051180 Free PMC article.
-
Do Socioeconomic Inequalities in Neonatal Mortality Reflect Inequalities in Coverage of Maternal Health Services? Evidence from 48 Low- and Middle-Income Countries.Matern Child Health J. 2016 Feb;20(2):434-46. doi: 10.1007/s10995-015-1841-8. Matern Child Health J. 2016. PMID: 26546016
-
Time trends in ethnic inequalities in child health and nutrition: analysis of 59 low and middle-income countries.Int J Equity Health. 2023 Apr 28;22(1):76. doi: 10.1186/s12939-023-01888-5. Int J Equity Health. 2023. PMID: 37118789 Free PMC article.
-
Not all inequalities are equal: differences in coverage across the continuum of reproductive health services.BMJ Glob Health. 2019 Sep 3;4(5):e001695. doi: 10.1136/bmjgh-2019-001695. eCollection 2019. BMJ Glob Health. 2019. PMID: 31544002 Free PMC article. Review.
-
Socio-economic inequalities in childhood mortality in low- and middle-income countries: a review of the international evidence.Br Med Bull. 2010;93:7-26. doi: 10.1093/bmb/ldp048. Epub 2009 Dec 9. Br Med Bull. 2010. PMID: 20007188 Review.
Cited by
-
Social inequalities in health and mental health in France. The results of a 2010 population-based survey in Paris Metropolitan Area.PLoS One. 2018 Sep 14;13(9):e0203676. doi: 10.1371/journal.pone.0203676. eCollection 2018. PLoS One. 2018. PMID: 30216375 Free PMC article.
-
Health inequalities among children and adolescents in Germany. Developments over time and trends from the KiGGS study.J Health Monit. 2019 Mar 14;4(1):15-37. doi: 10.25646/5871. eCollection 2019 Mar. J Health Monit. 2019. PMID: 35146241 Free PMC article.
-
Health inequalities in Germany and in international comparison: trends and developments over time.J Health Monit. 2018 Mar 20;3(Suppl 1):1-24. doi: 10.17886/RKI-GBE-2018-036. eCollection 2018 Mar. J Health Monit. 2018. PMID: 35586261 Free PMC article.
-
Household income and maternal education in early childhood and risk of overweight and obesity in late childhood: Findings from seven birth cohort studies in six high-income countries.Int J Obes (Lond). 2022 Sep;46(9):1703-1711. doi: 10.1038/s41366-022-01171-7. Epub 2022 Jul 11. Int J Obes (Lond). 2022. PMID: 35821522 Free PMC article.
-
Are state-level income-based disparities in adult smoking declining?Prev Med. 2020 Feb 10;133:106019. doi: 10.1016/j.ypmed.2020.106019. Online ahead of print. Prev Med. 2020. PMID: 32057958 Free PMC article.
References
-
- World Health Organization . Health21: The health for all policy framework for the WHO European Region European Health for All Series; No 6. Copenhagen: WHO Regional Office for Europe; 1999.
LinkOut - more resources
Full Text Sources
Research Materials
