

Modeling human papillomavirus and cervical cancer in the United States for analyses of screening and vaccination
- PMID: 17967185
- PMCID: PMC2213637
- DOI: 10.1186/1478-7954-5-11
Modeling human papillomavirus and cervical cancer in the United States for analyses of screening and vaccination
Abstract
Background: To provide quantitative insight into current U.S. policy choices for cervical cancer prevention, we developed a model of human papillomavirus (HPV) and cervical cancer, explicitly incorporating uncertainty about the natural history of disease.
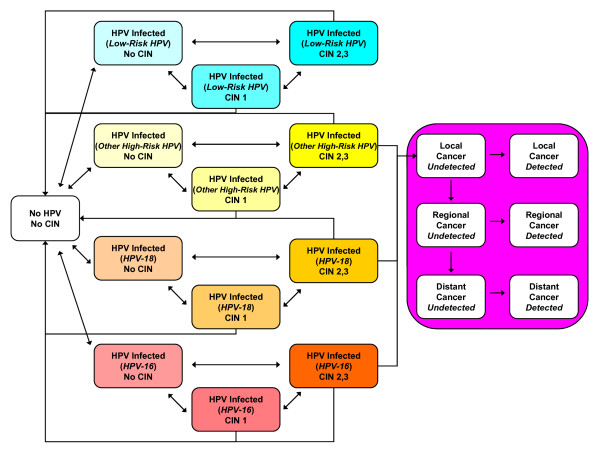
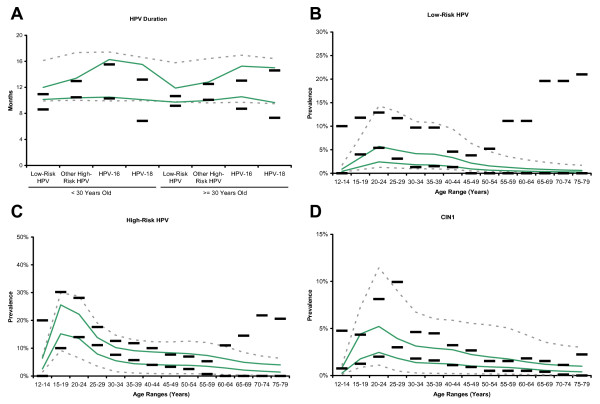
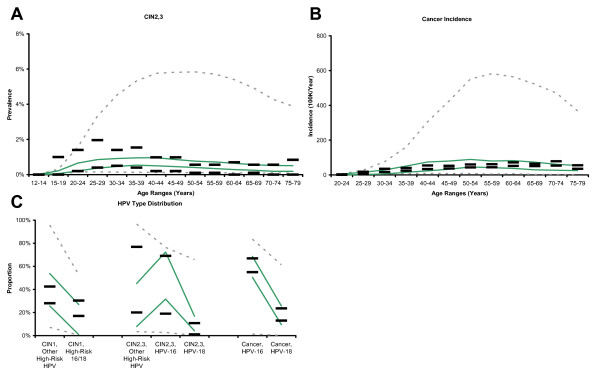
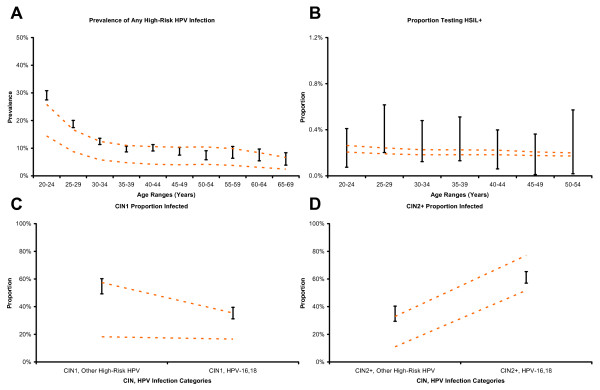
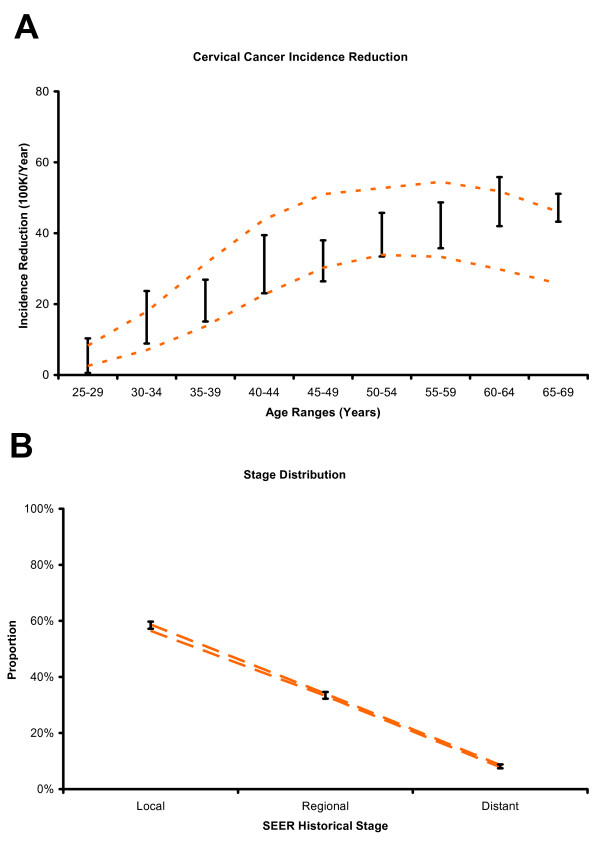
Methods: We developed a stochastic microsimulation of cervical cancer that distinguishes different HPV types by their incidence, clearance, persistence, and progression. Input parameter sets were sampled randomly from uniform distributions, and simulations undertaken with each set. Through systematic reviews and formal data synthesis, we established multiple epidemiologic targets for model calibration, including age-specific prevalence of HPV by type, age-specific prevalence of cervical intraepithelial neoplasia (CIN), HPV type distribution within CIN and cancer, and age-specific cancer incidence. For each set of sampled input parameters, likelihood-based goodness-of-fit (GOF) scores were computed based on comparisons between model-predicted outcomes and calibration targets. Using 50 randomly resampled, good-fitting parameter sets, we assessed the external consistency and face validity of the model, comparing predicted screening outcomes to independent data. To illustrate the advantage of this approach in reflecting parameter uncertainty, we used the 50 sets to project the distribution of health outcomes in U.S. women under different cervical cancer prevention strategies.
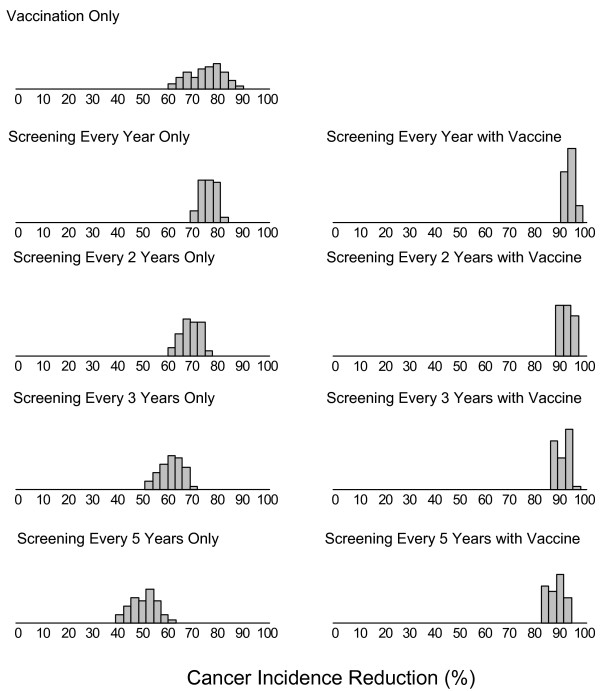
Results: Approximately 200 good-fitting parameter sets were identified from 1,000,000 simulated sets. Modeled screening outcomes were externally consistent with results from multiple independent data sources. Based on 50 good-fitting parameter sets, the expected reductions in lifetime risk of cancer with annual or biennial screening were 76% (range across 50 sets: 69-82%) and 69% (60-77%), respectively. The reduction from vaccination alone was 75%, although it ranged from 60% to 88%, reflecting considerable parameter uncertainty about the natural history of type-specific HPV infection. The uncertainty surrounding the model-predicted reduction in cervical cancer incidence narrowed substantially when vaccination was combined with every-5-year screening, with a mean reduction of 89% and range of 83% to 95%.
Conclusion: We demonstrate an approach to parameterization, calibration and performance evaluation for a U.S. cervical cancer microsimulation model intended to provide qualitative and quantitative inputs into decisions that must be taken before long-term data on vaccination outcomes become available. This approach allows for a rigorous and comprehensive description of policy-relevant uncertainty about health outcomes under alternative cancer prevention strategies. The model provides a tool that can accommodate new information, and can be modified as needed, to iteratively assess the expected benefits, costs, and cost-effectiveness of different policies in the U.S.
Figures
Similar articles
-
Decision-analytic modeling to evaluate the long-term effectiveness and cost-effectiveness of HPV-DNA testing in primary cervical cancer screening in Germany.GMS Health Technol Assess. 2010 Apr 27;6:Doc05. doi: 10.3205/hta000083. GMS Health Technol Assess. 2010. PMID: 21289878 Free PMC article.
-
Prophylaxis of cervical cancer and related cervical disease: a review of the cost-effectiveness of vaccination against oncogenic HPV types.J Manag Care Pharm. 2010 Apr;16(3):217-30. doi: 10.18553/jmcp.2010.16.3.217. J Manag Care Pharm. 2010. PMID: 20331326 Free PMC article. Review.
-
Human papillomavirus (HPV) vaccination for the prevention of HPV 16/18 induced cervical cancer and its precursors.GMS Health Technol Assess. 2009 Mar 11;5:Doc04. doi: 10.3205/hta000066. GMS Health Technol Assess. 2009. PMID: 21289891 Free PMC article.
-
Screening for Cervical Cancer With High-Risk Human Papillomavirus Testing: A Systematic Evidence Review for the U.S. Preventive Services Task Force [Internet].Rockville (MD): Agency for Healthcare Research and Quality (US); 2018 Aug. Report No.: 17-05231-EF-1. Rockville (MD): Agency for Healthcare Research and Quality (US); 2018 Aug. Report No.: 17-05231-EF-1. PMID: 30256575 Free Books & Documents. Review.
-
Multiparameter calibration of a natural history model of cervical cancer.Am J Epidemiol. 2007 Jul 15;166(2):137-50. doi: 10.1093/aje/kwm086. Epub 2007 May 25. Am J Epidemiol. 2007. PMID: 17526866
Cited by
-
The Possible Effects on Socio-Economic Inequalities of Introducing HPV Testing as Primary Test in Cervical Cancer Screening Programs.Front Oncol. 2014 Feb 10;4:20. doi: 10.3389/fonc.2014.00020. eCollection 2014. Front Oncol. 2014. PMID: 24575388 Free PMC article. Review.
-
Modeling and calibration for exposure to time-varying, modifiable risk factors: the example of smoking behavior in India.Med Decis Making. 2015 Feb;35(2):196-210. doi: 10.1177/0272989X13518272. Epub 2014 Jan 29. Med Decis Making. 2015. PMID: 24477078 Free PMC article.
-
Some Health States Are Better Than Others: Using Health State Rank Order to Improve Probabilistic Analyses.Med Decis Making. 2016 Nov;36(8):927-40. doi: 10.1177/0272989X15605091. Epub 2015 Sep 16. Med Decis Making. 2016. PMID: 26377369 Free PMC article.
-
Effectiveness and cost effectiveness of human papillomavirus vaccine: a systematic review.Pharmacoeconomics. 2009;27(2):127-47. doi: 10.2165/00019053-200927020-00004. Pharmacoeconomics. 2009. PMID: 19254046
-
Type-specific prevalence of high-risk human papillomavirus by cervical cytology and age: Data from the health check-ups of 7,014 Korean women.Obstet Gynecol Sci. 2013 Mar;56(2):110-20. doi: 10.5468/OGS.2013.56.2.110. Epub 2013 Mar 12. Obstet Gynecol Sci. 2013. PMID: 24327989 Free PMC article.
References
-
- Saraiya M, Ahmed F, Krishnan S, Richards TB, Unger ER, Lawson HW. Cervical cancer incidence in a prevaccine era in the United States, 1998–2002. Obstet Gynecol. 2007;109:360–370. - PubMed
-
- Yabroff KR, Lawrence WF, King JC, Mangan P, Washington KS, Yi B, Kerner JF, Mandelblatt JS. Geographic disparities in cervical cancer mortality: what are the roles of risk factor prevalence, screening, and use of recommended treatment? J Rural Health. 2005;21:149–157. doi: 10.1111/j.1748-0361.2005.tb00075.x. - DOI - PubMed
Grants and funding
LinkOut - more resources
Full Text Sources
