. 2008 Jan;28(1):468-86.
doi: 10.1128/MCB.01517-07. Epub 2007 Oct 29.

Certain and progressive methylation of histone H4 at lysine 20 during the cell cycle

Affiliations

Certain and progressive methylation of histone H4 at lysine 20 during the cell cycle

James J Pesavento et al. Mol Cell Biol. 2008 Jan.

Abstract

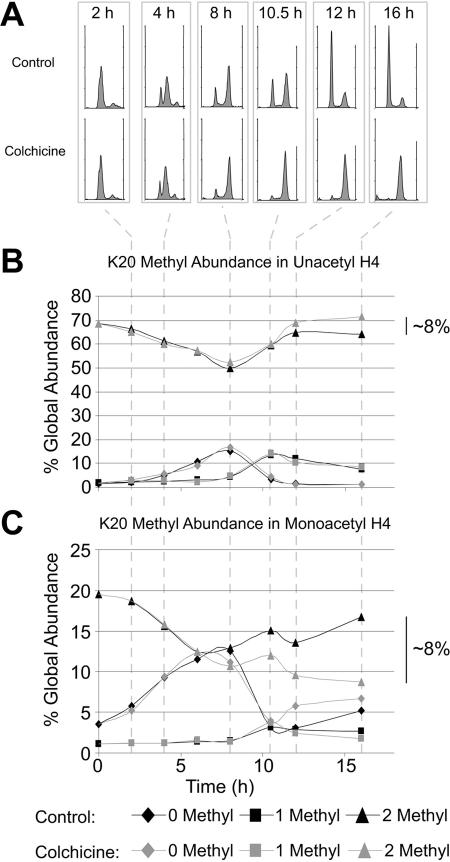
Methylation of histone H4 at lysine 20 (K20) has been implicated in transcriptional activation, gene silencing, heterochromatin formation, mitosis, and DNA repair. However, little is known about how this modification is regulated or how it contributes to these diverse processes. Metabolic labeling and top-down mass spectrometry reveal that newly synthesized H4 is progressively methylated at K20 during the G(2), M, and G(1) phases of the cell cycle in a process that is largely inescapable and irreversible. Approximately 98% of new H4 becomes dimethylated within two to three cell cycles, and K20 methylation turnover in vivo is undetectable. New H4 is methylated regardless of prior acetylation, and acetylation occurs predominantly on K20-dimethylated H4, refuting the hypothesis that K20 methylation antagonizes H4 acetylation and represses transcription epigenetically. Despite suggestions that it is required for normal mitosis and cell cycle progression, K20 methylation proceeds normally during colchicine treatment. Moreover, delays in PR-Set7 synthesis and K20 methylation which accompany altered cell cycle progression during sodium butyrate treatment appear to be secondary to histone hyperacetylation or other effects of butyrate since depletion of PR-Set7 did not affect cell cycle progression. Together, our data provide an unbiased perspective of the regulation and function of K20 methylation.


Figures

FIG. 1.
FIG. 1.
Mass spectra of intact histone H4 from asynchronously growing HeLa S3 cells before (A) and after (B) mitotic arrest by colchicine treatment. Acid-extracted histones were oxidized with 3% performic acid (40) and separated by RP-HPLC. The single peak of H4 from each sample was recovered, and the chemically distinct components were resolved by ESI-Q/FTMS. Modifications were identified and localized to single amino acids by MS/MS following the isolation of each form and ECD. In most cases, the entire N-terminal region of H4 was almost completely sequenced de novo by ECD, allowing modification site isomers (e.g., 2mR3 from 2mK20) to be distinguished. All forms were α-N acetylated at residue 1; hence, unmodified H4 is labeled aαS1. Residues bearing PTMs are noted in one-letter code, with acetylation, monomethylation, dimethylation, trimethylation, and phosphorylation indicated by a, m, 2m, 3m, and p, respectively. The spectra of the most abundant charge state (+12) for each sample are shown after normalization to the most abundant component.
FIG. 2.
FIG. 2.
Histone H4 MS profiles report changes in acetylation and methylation levels during the cell cycle. A double-thymidine block was implemented to synchronize cells at the G1/S border. (A) Cells were harvested at ∼2-h intervals postrelease. Cell cycle progression was monitored by flow cytometry of cells stained with propidium iodide (left of each MS profile). The mass spectra from the +12 charge state of histone H4 prepared as previously described (41) are shown after normalization to the most abundant component. Dotted lines align the K20-unmethylated forms of unacetylated (Δm = +42 Da), monoacetylated (Δm = +84 Da), and diacetylated (Δm = +126 Da) molecules in the staggered profiles. Trimethylation also has Δm = +84 Da but is present at only minor levels (40). (B) The total abundance of un-, mono-, and diacetylated molecules throughout the cell cycle based on their MS PIRRs (42) is shown. (C) Similarly, the abundance of K20 unmethylation (♦), monomethylation (▪), and dimethylation (▴) within the pools of un-, mono-, and diacetyl molecules throughout the cell cycle is shown. (D) Enlargement of the lower portion of the unacetyl graph in panel C. 3mK20-H4 is present at very low levels and displays a biphasic pattern during the cell cycle. The data are representative of four independent experiments.
FIG. 3.
FIG. 3.
SILAC reveals that K20 methylation is progressive, occurs largely on newly synthesized H4, and is not antagonized by prior acetylation. HeLa S3 cells arrested at the G1/S boundary by sequential thymidine blocks were released into medium containing [3C, 15N]arginine and [13C, 15N]valine. H4 was purified by RP-HPLC and digested with endoproteinase Glu-C to generate a 1-63 H4 peptide. ESI-Q/FTMS spectra of the +9 charge state of the 1-63 H4 peptide prepared from cells at 4 (mid-S), 8 (S/G2), 10.5 (G2/M), 12 (M/G1), 15 (G1), and 24 (G1/S) h postrelease are shown normalized to the most abundant component. “Old” H4 synthesized in previous cell cycles is shown in black on the left (∼6,900 Da), while “new” H4 synthesized with [13C,15N]Arg and [13C,15N]Val is shown in gray on the right (∼7,040 Da). Flow cytometry profiles are shown beside the corresponding MS profiles. New histone from the second S phase following release from thymidine block 2 is depicted by an asterisk in the 24-h (G1/S) sample.
FIG. 4.
FIG. 4.
K20 methylation proceeds at similar rates on newly synthesized unmodified and monoacetylated molecules and does not influence acetylation site occupancies. (A) The relative amounts of the unmethylated (♦), monomethylated (▪), and dimethylated (▴) K20 forms in the unacetylated (left graph) and monoacetylated (right graph) pools of newly synthesized H4 during the cell cycle (shaded gray in Fig. 3) were determined with their MS PIRRs (42). Both graphs show that newly synthesized H4 remained unmethylated at K20 during S phase and then was progressively mono- and dimethylated during M phase (∼10 h) and afterward. (B) The relative ratio of H4 monoacetylated at K16 (♦) or K12 (▪) for the H4 pools which were either un-, mono-, or dimethylated at K20 throughout the cell cycle are shown. Dotted lines estimate the course of large changes in the ratio between samples.
FIG. 5.
FIG. 5.
Lack of methylation turnover at K20 reveals that dimethyl K20 is a stable epigenetic mark. (A) HeLa cells growing asynchronously in regular medium were shifted to medium containing [3C, 15N]arginine, [13C, 15N]valine, and l-[13C-methyl-D3]methionine. The mass of H4 synthesized after this change is 198 Da greater than usual assuming quantitative incorporation of these isotopic amino acids. De novo methylation gives a mass increase of 18 Da instead of 14 Da since heavy methyl-13CD3 is transferred from SAM. Under these conditions, it is possible to have a dimethylated population consisting of two unlabeled methyls (i.e., 2mK20), one unlabeled methyl and one labeled methyl (i.e., mm′K20), or two labeled methyls (m′m′K20). The isotopic distribution shown enlarged in the 0-h sample corresponds to a completely unlabeled dimethylated molecule with the most abundant isotopic peak indicated by the asterisk. The *′ and *″ symbols represent the most abundant isotope of the mm′K20 and m′m′K20 molecules, respectively. After 30 h, the isotopes *′ and *″ increased in abundance due to dimethylation of previously unmethylated and mK20 molecules present at 0 h with 13CD3 groups, creating molecules with m′m′K20 and mm′K20, respectively. However, the abundances of the *′ and *″ peaks did not increase after 30 h, suggesting that dimethylation is a stable epigenetic mark and does not undergo turnover. (B) The abundances of parental (old) unacetylated 0m, 1m, and 2mK20-H4 were monitored after release into stable isotope labeling medium. The abundance of the 0m and 1mK20 populations decreased concomitantly with the increase in 2mK20 abundance, suggesting that these forms are largely converted to the 2mK20 state and that K20 dimethylation is the stable end state for most parental H4.
FIG. 6.
FIG. 6.
H4 hyperacetylation following sodium butyrate treatment is associated with delays in PR-Set7 expression, K20 monomethylation, and cell cycle progression but does not prevent progressive methylation of K20. (A) HeLa S3 cells arrested at the G1/S boundary by sequential thymidine blocks were released into [3C, 15N]arginine- and [13C, 15N]valine-containing medium with or without butyrate. The molecular mass of histone H4 synthesized in the ensuing S phase was increased by +194 Da for incorporation at all 14 Arg and 9 Val residues per molecule. Mass spectra of the +12 charge state of intact H4 prepared from cells at 8 (S/G2), 10.5 (M/G1), 15 (G1), and 24 (G1) h postrelease are shown after normalization to the most abundant component. “Old” H4 synthesized in previous cell cycles is shown in black in the 11,271- to 11,510-Da mass range. “New” H4 synthesized with [13C,15N]Arg and [13C,15N]Val is shown in gray in the 11,460- to 11,700-Da mass range. The region corresponding to newly synthesized, labeled H4 is enlarged above the corresponding mass spectrum. Newly synthesized, K20-unmethylated H4 is shaded light gray, K20-monomethylated H4 is shaded medium gray, and K20-dimethylated H4 is dark gray. The total abundances of the old histone and new histone are presumed to be similar, but peak broadening due to the incorporation of small amounts of nonisotopic arginine and valine gives the impression that new H4 is less abundant than it should be. The corresponding mass spectrum from the control SILAC experiment without butyrate is shown in the insets on the far right. (B) Flow cytometry profiles of cells released into fresh medium (2xTDR) or medium containing 10 mM sodium butyrate (2xTDR plus butyrate). A delay in cell cycle progression of butyrate-treated cells became apparent coincidently with the time of M phase in control cells (∼10 h). (C) Western blot analysis of PR-Set7 expression (left) and tubulin (right) in synchronized cells in the absence (top) or presence (bottom) of butyrate. The normal onset of PR-Set7 expression was delayed in butyrate-treated cells.
FIG. 7.
FIG. 7.
PR-Set7 depletion delays K20 mono- and dimethylation but does not affect cell cycle progression. (A) HeLa cells were treated with siRNA targeting PR-Set7 (right MS) or firefly luciferase as a control (left MS) for 4 days prior to initiation of cell synchronization. Mass spectra of H4 prepared at 4 (mid-S), 8 (S/G2), 10.5 (M/G1), and 15 (G1) h following release from the second thymidine block are shown after normalization to the most abundant component. All methylations (m) were localized to K20. (*) The major species present in this isotopic cluster is 1Ac, 0m; however, the 0Ac, 3m form (i.e., 3mK20-H4) is also present in minor amounts. (B) Relative abundances of the 0m, 1m and 2mK20 forms within the pool of unacetylated H4 in control and PR-Set7-depleted cells. (C) Immunoblot analysis confirms that Pr-Set7 expression is markedly reduced in siRNA-treated cells relative to the control. Tubulin levels were monitored to ensure equivalent loading. The level of PR-Set7 remaining in PR-Set7-depleted cells relative to the control cells determined by densitometry of the film for each time point is shown below the corresponding lanes. RNAi, RNA interference.
FIG. 8.
FIG. 8.
K20 methylation is not impaired by mitotic arrest following colchicine treatment. (A) Cells were synchronized by the double-thymidine block procedure and then released into medium with or without 1 μM colchicine. Flow cytometry revealed that the control synchrony cycled through all phases while the colchicine samples were arrested in M phase. (B) The relative abundance of unacetylated molecules with un-, mono-, or dimethyl K20 throughout the cell cycle in the control (black) and colchicine-treated (gray) samples is shown. (C) The relative abundance of monoacetylated molecules with un-, mono-, or dimethyl K20 throughout the cell cycle for the control (black) and colchicine-treated (gray) samples is shown. Since only intact abundances were used to calculate ratios, the +84 species may contain some 3mK20. However, this population is minor compared to the monoacetyl population (40) (Fig. 1).

Similar articles

Cited by

References

    1. Barber, C. M., F. B. Turner, Y. Wang, K. Hagstrom, S. D. Taverna, S. Mollah, B. Ueberheide, B. J. Meyer, D. F. Hunt, P. Cheung, and C. D. Allis. 2004. The enhancement of histone H4 and H2A serine 1 phosphorylation during mitosis and S-phase is evolutionarily conserved. Chromosoma 112360-371. - PubMed
    1. Barski, A., S. Cuddapah, K. Cui, T. Y. Roh, D. E. Schones, Z. Wang, G. Wei, I. Chepelev, and K. Zhao. 2007. High-resolution profiling of histone methylations in the human genome. Cell 129823-837. - PubMed
    1. Beisel, C., A. Imhof, J. Greene, E. Kremmer, and F. Sauer. 2002. Histone methylation by the Drosophila epigenetic transcriptional regulator Ash1. Nature 419857-862. - PubMed
    1. Botuyan, M. V., J. Lee, I. M. Ward, J. E. Kim, J. R. Thompson, J. Chen, and G. Mer. 2006. Structural basis for the methylation state-specific recognition of histone H4-K20 by 53BP1 and Crb2 in DNA repair. Cell 1271361-1373. - PMC - PubMed
    1. Boyne, M. T., II, J. J. Pesavento, C. A. Mizzen, and N. L. Kelleher. 2006. Precise characterization of human histones in the H2A gene family by top down mass spectrometry. J. Proteome Res. 5248-253. - PubMed

Publication types