. 2008 Jan;28(1):165-76.
doi: 10.1128/MCB.00863-07. Epub 2007 Oct 29.

Regulation of Notch signaling by dynamic changes in the precision of S3 cleavage of Notch-1

Affiliations

Regulation of Notch signaling by dynamic changes in the precision of S3 cleavage of Notch-1

Shinji Tagami et al. Mol Cell Biol. 2008 Jan.

Abstract

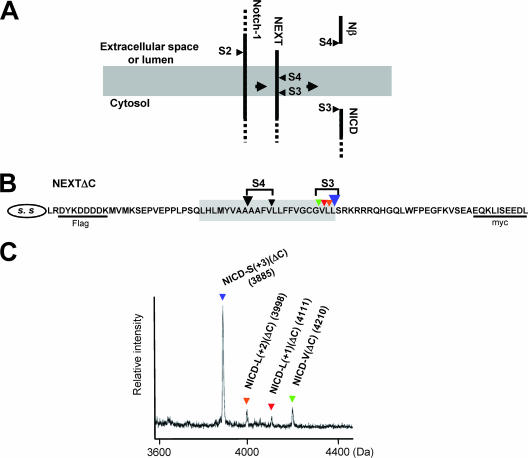
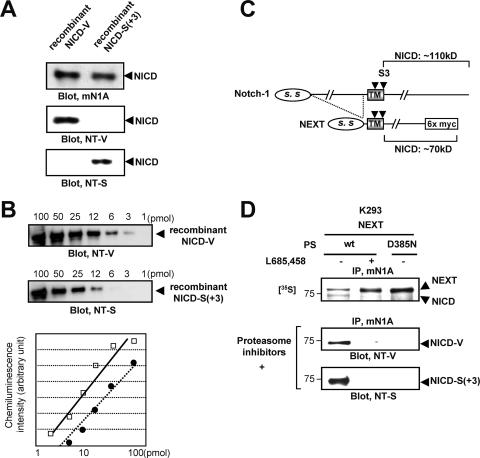
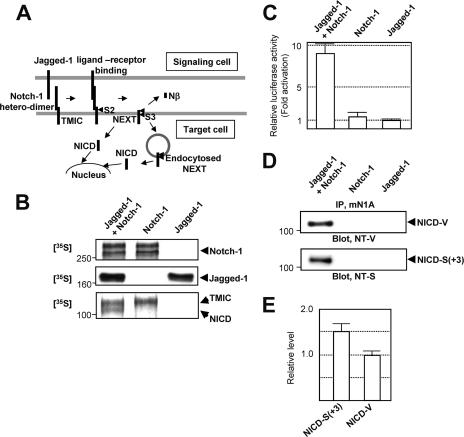
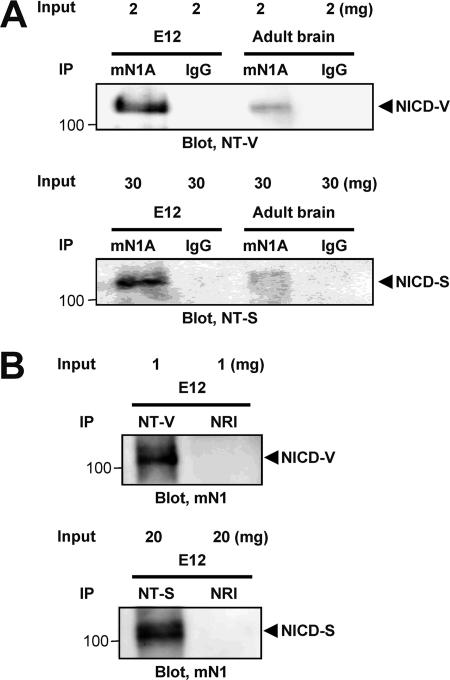
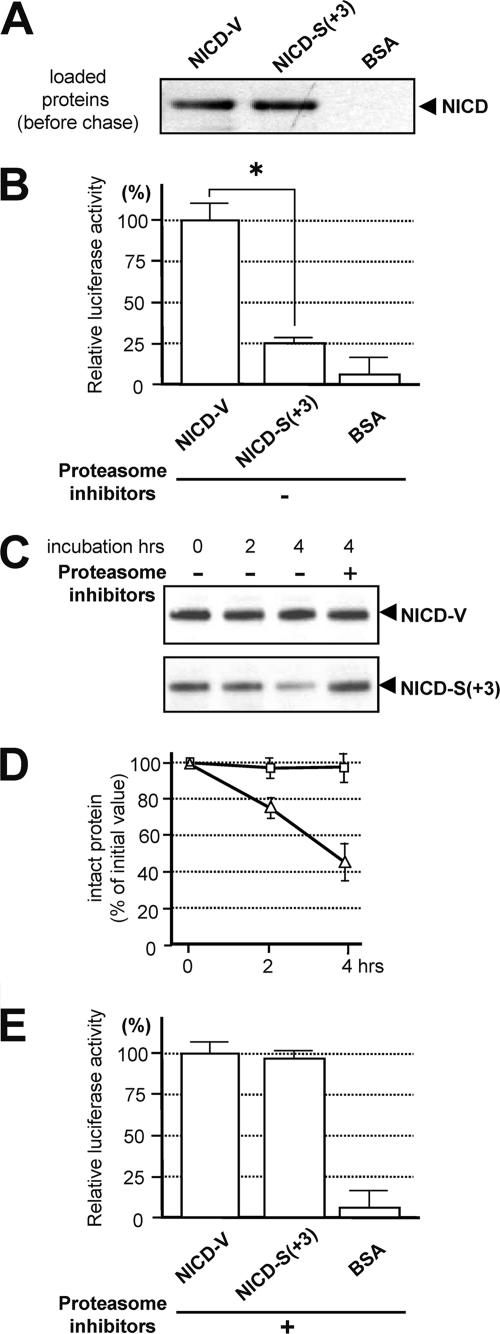
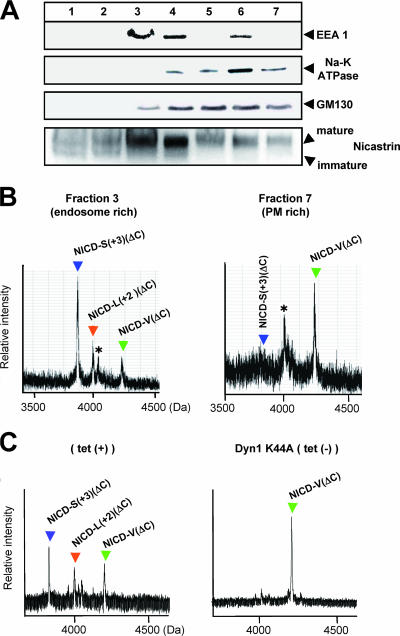
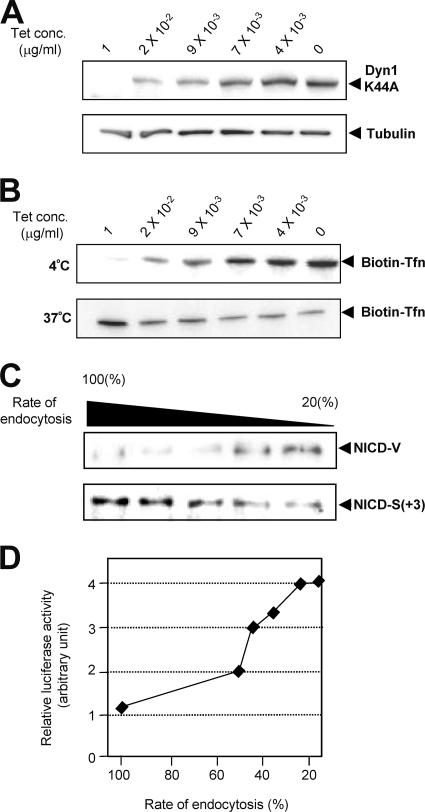
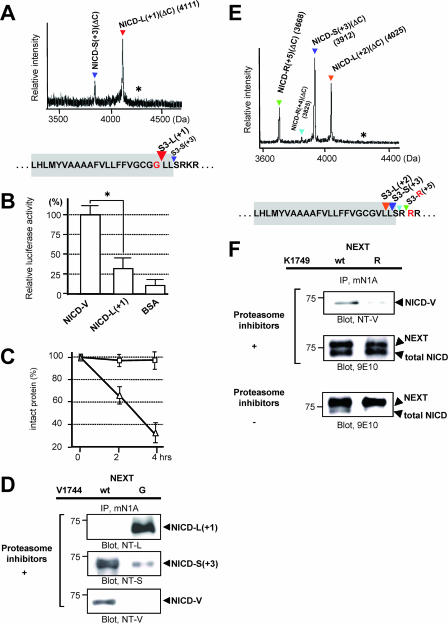
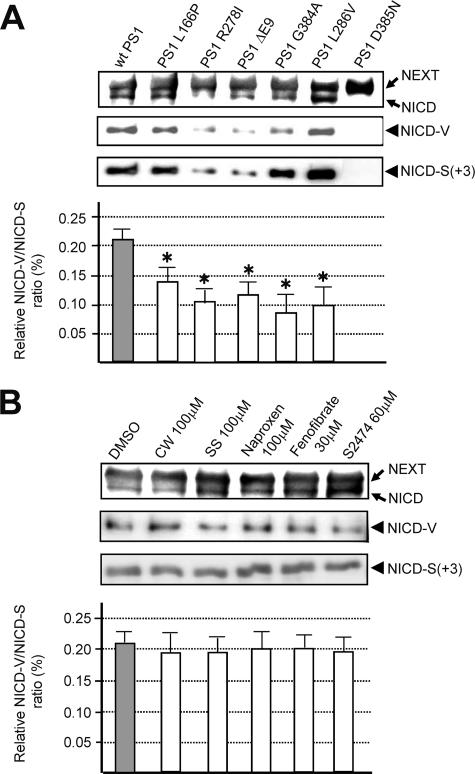
Intramembrane proteolysis by presenilin-dependent gamma-secretase produces the Notch intracellular cytoplasmic domain (NCID) and Alzheimer disease-associated amyloid-beta. Here, we show that upon Notch signaling the intracellular domain of Notch-1 is cleaved into two distinct types of NICD species due to diversity in the site of S3 cleavage. Consistent with the N-end rule, the S3-V cleavage produces stable NICD with Val at the N terminus, whereas the S3-S/S3-L cleavage generates unstable NICD with Ser/Leu at the N terminus. Moreover, intracellular Notch signal transmission with unstable NICDs is much weaker than that with stable NICD. Importantly, the extent of endocytosis in target cells affects the relative production ratio of the two types of NICD, which changes in parallel with Notch signaling. Surprisingly, substantial amounts of unstable NICD species are generated from the Val-->Gly and the Lys-->Arg mutants, which have been reported to decrease S3 cleavage efficiency in cultured cells. Thus, we suggest that the existence of two distinct types of NICD points to a novel aspect of the intracellular signaling and that changes in the precision of S3 cleavage play an important role in the process of conversion from extracellular to intracellular Notch signaling.


Figures

FIG. 1.
FIG. 1.
MALDI-TOF MS analysis of NICD(ΔC) produced by the cell-free Notch-1 cleavage assay. (A) Schematic representation of sequential endoproteolysis of Notch-1. S2 to S4 and the gray area represent the proteolytic sites and the putative TM, respectively. (B) Schematic representation of the NEXTΔC construct used in the cell-free Notch-1 cleavage assay. Colored inverted triangles show the S3 and S4 proteolytic sites. SS, signal sequence. (C) MS spectrum of de novo NICD(ΔC) generated in the cell-free assay. CMF was derived from K293 cells stably expressing NEXTΔC. The molecular mass of each species is indicated. To inhibit degradation by proteases other than aspartyl proteases, BSA and a mixture of metallo-, serine, and cysteine protease inhibitors were added to the cell-free assay buffer. Colored inverted triangles indicate the NICD(ΔC) species produced by cleavage at the sites shown in panel B.
FIG. 2.
FIG. 2.
Characterization of capping antibodies to the N terminus of NICD and detection of distinct NICD species in cultured cells. (A) Specificities of the anti-NT-V and the anti-NT-S antibodies. Immunoblotting with antibody mN1A confirmed that equal amounts of the polypeptides were loaded in each lane (upper panel). (B) Affinities of the anti-NT-V and anti-NT-S antibodies. The indicated amounts of NICD-V or NICD-S(+3) were separated by SDS-PAGE and analyzed by immunoblotting with the anti-NT-V or anti-NT-S antibody, respectively. The graph shows the chemiluminescence intensity versus the concentration of NICD-V (squares) or NICD-S(+3) (circles). Each antibody detected the respective polypeptide in a dose-dependent manner. (C) Schematic representation of Notch-1 and NEXT constructs. The C-terminal portion of the NEXT construct is replaced by myc6, while full-length Notch-1 has no modification. Note that the molecular mass of NICD generated from NEXT-myc6 is ∼70 kDa, while that of NICD generated from unmodified Notch-1 is ∼110 kDa. (D) Generation of NICD-V and NICD-S(+3) in cultured cells. Proteasome inhibitors lactacystin (10 μM), MG262 (100 nM), and NLVS (10 μM) were added to the medium 12 h prior to cell collection.
FIG. 3.
FIG. 3.
Detection of different NICD species during Notch signaling. (A) Schematic representation of Notch signaling. (B) Notch signaling in cell culture. CHO(r) cells stably expressing Jagged-1 or Notch-1 were used. Expression of Notch-1 (top panel) and Jagged-1 (middle panel) was determined by a 1-h pulse experiment, followed by immunoprecipitation using antibodies mN1A and H114, respectively. The precipitated proteins were analyzed by SDS-PAGE, followed by autoradiography. A 1-h pulse/2-h chase experiment detected an ∼110-kDa NICD band only when the cells were cocultured (bottom panel). (C) Notch signaling was measured using a dual luciferase assay. The relative luciferase activity of Jagged-expressing cells was defined as 1.0. Values represent means ± standard deviations (n = 3). (D) In the presence of the proteasome inhibitors, both NICD-V (upper panel) and NICD-S(+3) (lower panel) were detected during Notch signaling. The bands were detected as described for Fig. 2D. (E) Relative levels of NICD-S(+3) and NICD-V generated during Notch signaling. The relative levels were calculated based on the standard curve shown in Fig. 2B.
FIG. 4.
FIG. 4.
Detection of NICD-V and NICD-S(+3) in vivo. The indicated amounts of nuclear extracts were loaded for immunoprecipitation. IgG and NRI, isotype-matched immunoglobulin and normal rabbit immunoglobulin, respectively.
FIG. 5.
FIG. 5.
Characterization of the NICD species. (A) Loading of cells with NICD. HeLa cells (2.5 × 10⁵) were loaded with 5 μg of purified NICD-V, NICD-S(+3), or BSA (control). The cells were collected 1 h after the addition of the Chariot macromolecule complex (defined as the loading period). (B) Assay of Notch downstream signaling induced by the NICD species. The NICD-loaded cells from panel A were chased for 4 h and collected, and Notch downstream signaling was assayed. The values were corrected for background luciferase activity (0.5 μg of β-galactosidase-loaded cells), and the luciferase activity in the NICD-V-loaded cells was defined as 100%. Values represent means ± standard deviations (n = 3). The asterisk indicates that the relative luciferase activity in NICD-V-loaded cells is statistically different than that in NICD-S(+3)-loaded cells (P < 0.001). Similar results were obtained using cells expressing pGa981-6 (data not shown). (C) Stability of recombinant NICD species in rabbit reticulocyte lysate. Note that the degradation of NICD-S(+3) was inhibited in the presence of proteasome inhibitors. (D) Levels of intact NICDs in the lysates during in vitro degradation. The amount of intact polypeptide was determined using a standard curve of the chemiluminescence intensities of the bands versus their concentrations (data not shown). Squares and triangles indicate the means for NICD-V and NICD-S(+3), respectively. Values represent means ± standard deviations (n = 3). (E) Assay of Notch downstream signaling induced by the NICD species in the presence of the proteasome inhibitor mixture. Experiments were performed as described for panel B in the presence of the proteasome inhibitor mixture. The values were corrected for background luciferase activity (0.5 μg of β-galactosidase-loaded cells), and the luciferase activity in the NICD-V-loaded cells was defined as 100%. Values represent means ± standard deviations (n = 3).
FIG. 6.
FIG. 6.
Subcellular locations where S3-V and S3-S(+3) cleavages occur. (A) Fractions from a 2.5% to 25% linear iodixanol gradient examined by immunoblotting with the indicated antibodies. (B) MS spectra of NICD(ΔC) generated in the cell-free assay using membranes collected by centrifugation from the endosome-rich (fraction 3) and the PM-rich (fraction 7) fractions. Asterisks indicate nonspecific peaks. (C) MS spectra of NICD(ΔC) generated in the cell-free assay. CMFs from HeLa cells stably expressing NEXT(ΔC) and conditionally expressing Dyn-1 K44A were used. The precision of PS-dependent cleavage at the TM-cytoplasmic border in HeLa (left panel) and K293 (Fig. 1C) cells was different, in agreement with a previous report (11).
FIG. 7.
FIG. 7.
Parallel change in the rate of endocytosis and the precision of S3 cleavage. (A) Expression of Dyn-1 K44A at various concentrations of tetracycline. Dyn-1 K44A/NEXT-coexpressing HeLa cells were cultured in medium with the indicated concentrations of tetracycline, and cell lysates were examined by immunoblotting with antibody 12CA5 (upper panel) or antitubulin (lower panel). The levels of Dyn-1 K44A increase as the concentration of tetracycline is decreased. (B) Various rates of endocytosis in Dyn-1 K44A expressing cells. Transferrin (Tfn) uptake assays were performed to measure the rate of endocytosis. The ratio of internalized Tfn (37°C; lower panel) to surface-bound Tfn (4°C; upper panel) in cells cultured in medium containing 1 μg/ml of tetracycline was defined as 100%. The rate of endocytosis decreased to ∼15% when tetracycline was completely withdrawn. (C) Effect of the rate of endocytosis on the NICD species. The calculated rates of endocytosis were 100%, 41%, 37%, 21%, and 15% in lanes 1 to 5, respectively. (D) A plot of the relative Notch downstream luciferase activity versus the rate of endocytosis at various tetracycline concentrations.
FIG. 8.
FIG. 8.
Characteristics of the NICD species generated from the Val→Gly and the Lys→Arg mutants in cultured cells. (A) MS spectrum of de novo NICD(ΔC) generated from the Val→Gly mutant of NEXTΔC in K293 cells. The asterisk indicates the position of molecular mass corresponding to NICD-G(ΔC) species. Colored letters and inverted triangles show the mutation and proteolytic sites, respectively. (B) Assay of Notch downstream signaling induced by NICD-L(+1). Experiments were performed as described for Fig. 5B. The luciferase activity in the NICD-V-loaded cells was defined as 100%. Values represent means ± standard deviations. (n = 3). The asterisk indicates that the relative luciferase activity in NICD-V-loaded cells is statistically different than that in NICD-L(+1)-loaded cells (P < 0.001). (C) Degradation of NICD-L(+1) species in vitro. Experiments were performed as described for Fig. 5C but using NICD-L(+1) (triangles) and NICD-V (squares). Values represent means ± standard deviations (n = 3). (D) Generation of NICD-L(+1) and NICD-S(+3) in the Val→Gly mutant NEXT cells. K293 cells expressing either wt or the Val→Gly mutant NEXT were analyzed as described for Fig. 2D. (E) MS spectrum of de novo NICD(ΔC) generated from the Lys→Arg mutant of NEXTΔC in K293 cells. The asterisk indicates the position of molecular mass corresponding to NICD-V(ΔC) species. Colored letters and inverted triangles show the mutation and proteolytic sites, respectively. (F) Generation of unstable NICD species in the Lys→Arg mutant NEXT cells. K293 cells expressing either wt or the Lys→Arg mutant NEXT were analyzed as described for Fig. 2D (top and middle panels).
FIG. 9.
FIG. 9.
Changes in the precision of S3 cleavage induced by FAD mutations in PS1. (A) Effect of several FAD PS1 mutations on the precision of S3 cleavage. K293 cells expressing the indicated PS mutant were transiently transfected with NEXT and analyzed as for Fig. 2D. The production of total NICD (first panel), NICD-V (second panel), and NICD-S(+3) (third panel) was assessed. Note that amount of total NICD was greatly reduced in PS1 R278I- and Δexon 9-expressing cells. The ratio of NICD-V to NICD-S(+3) in cells expressing wt PS1 or FAD mutants is shown in the bottom panel. Values represent means ± standard deviations (n = 3). The asterisk indicates that the ratio of NICD-V to NICD-S(+3) in cells expressing PS1 FAD mutants is significantly different from that in wt PS1-expressing cells (P < 0.002). (B) Effect of PS/γ-secretase modifiers on the precision of S3 cleavage. K293 cells stably expressing NEXT were treated with several PS/γ-secretase modifiers at the indicated concentration for 24 h and analyzed as described for the first three panels in panel A. DMSO, dimethyl sulfoxide; CW, compound W (31); SS, sulindac sulfide (49). The ratio of NICD-V to NICD-S(+3) in the control and treated cells is shown in the bottom panel. Values represent means ± standard deviations (n = 3).

Similar articles

Cited by

References

    1. Artavanis-Tsakonas, S., M. D. Rand, and R. J. Lake. 1999. Notch signaling: cell fate control and signal integration in development. Science 284770-776. - PubMed
    1. Bachmair, A., D. Finley, and A. Varshavsky. 1986. In vivo half-life of a protein is a function of its amino-terminal residue. Science 234179-186. - PubMed
    1. Berdnik, D., T. Torok, M. Gonzalez-Gaitan, and J. A. Knoblich. 2002. The endocytic protein alpha-adaptin is required for numb-mediated asymmetric cell division in Drosophila. Dev. Cell 3221-231. - PubMed
    1. Blat, Y., J. E. Meredith, Q. Wang, J. D. Bradley, L. A. Thompson, R. E. Olson, A. M. Stern, and D. Seiffert. 2002. Mutations at the P1′ position of Notch1 decrease intracellular domain stability rather than cleavage by gamma-secretase. Biochem. Biophys. Res. Commun. 299569-573. - PubMed
    1. Cao, X., and T. C. Sudhof. 2001. A transcriptionally active complex of APP with Fe65 and histone acetyltransferase Tip60. Science 293115-120. - PubMed

Publication types

MeSH terms

Substances