. 2008 Jan;28(1):511-27.
doi: 10.1128/MCB.00800-07. Epub 2007 Oct 29.

Single and combined silencing of ERK1 and ERK2 reveals their positive contribution to growth signaling depending on their expression levels

Affiliations

Single and combined silencing of ERK1 and ERK2 reveals their positive contribution to growth signaling depending on their expression levels

Renaud Lefloch et al. Mol Cell Biol. 2008 Jan.

Abstract

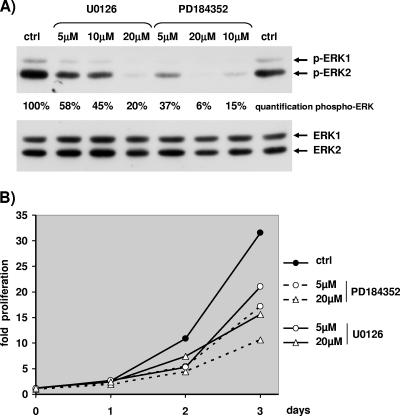
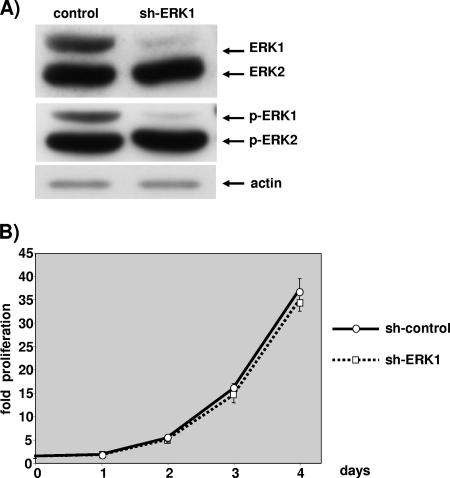
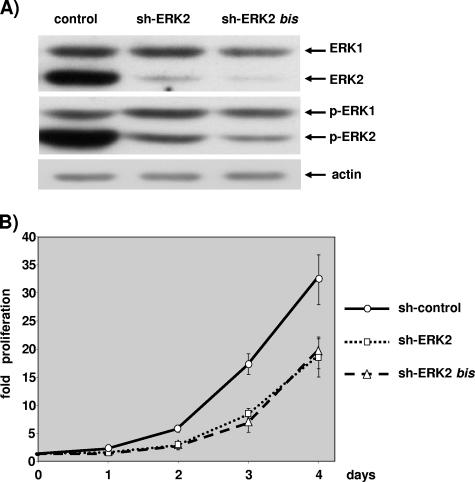
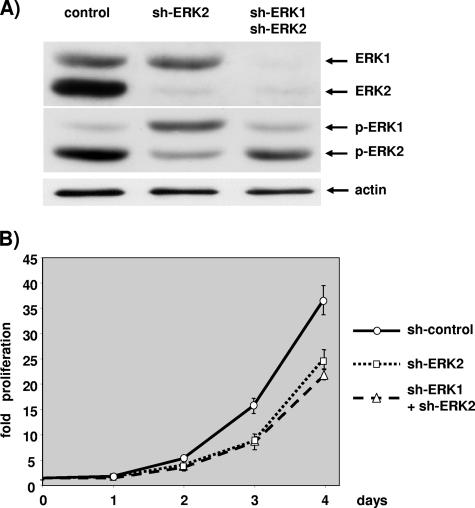
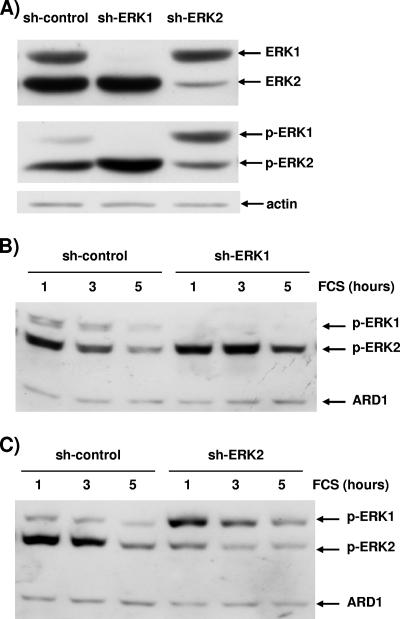
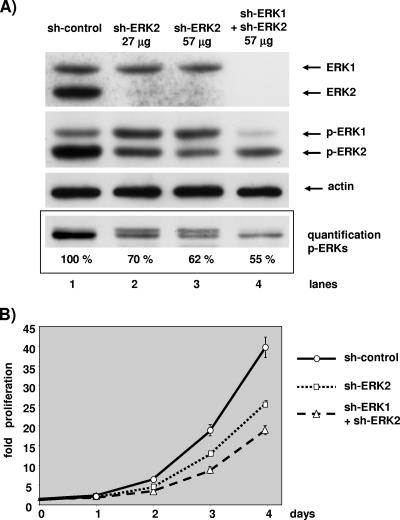
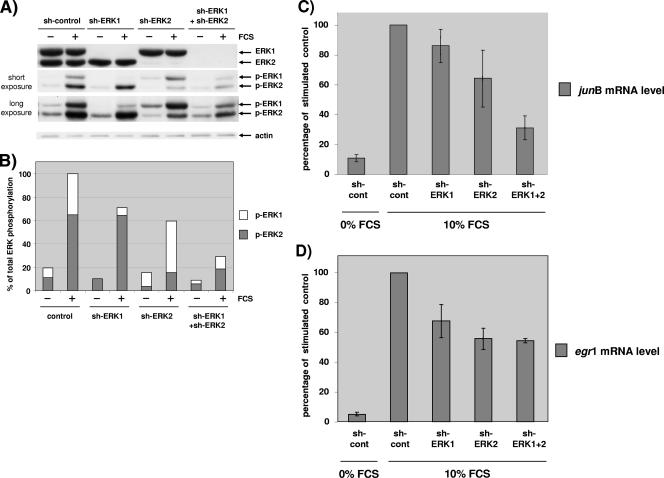
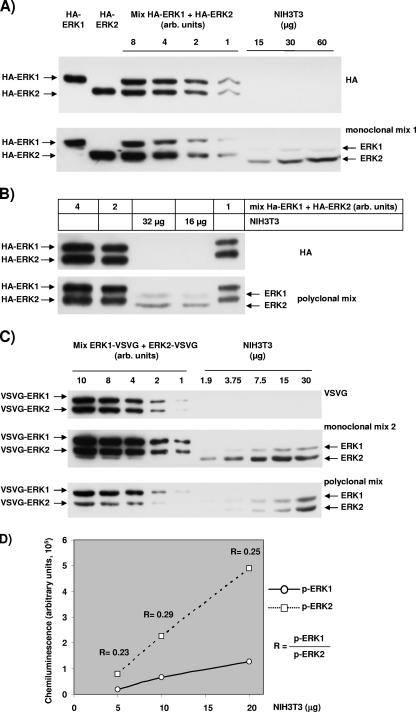
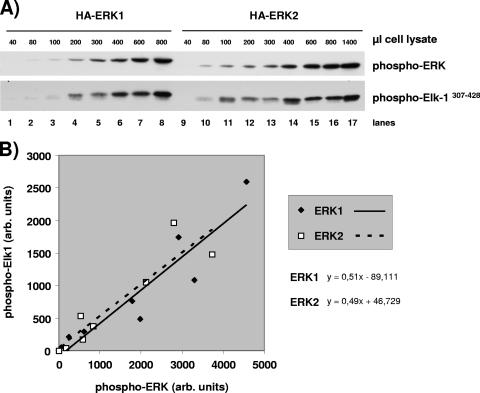
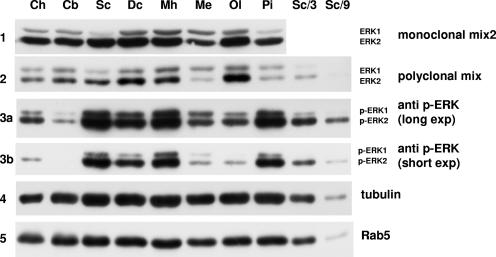
The proteins ERK1 and ERK2 are highly similar, are ubiquitously expressed, and share activators and substrates; however, erk2 gene invalidation is lethal in mice, while erk1 inactivation is not. We ablated ERK1 and/or ERK2 by RNA interference and explored their relative roles in cell proliferation and immediate-early gene (IEG) expression. Reducing expression of either ERK1 or ERK2 lowered IEG induction by serum; however, silencing of only ERK2 slowed down cell proliferation. When both isoforms were silenced simultaneously, compensating activation of the residual pool of ERK1/2 masked a more deleterious effect on cell proliferation. It was only when ERK2 activation was clamped at a limiting level that we demonstrated the positive contribution of ERK1 to cell proliferation. We then established that ERK isoforms are activated indiscriminately and that their expression ratio correlated exactly with their activation ratio. Furthermore, we determined for the first time that ERK1 and ERK2 kinase activities are indistinguishable in vitro and that erk gene dosage is essential for survival of mice. We propose that the expression levels of ERK1 and ERK2 drive their apparent biological differences. Indeed, ERK1 is dispensable in some vertebrates, since it is absent from chicken and frog genomes despite being present in all mammals and fishes sequenced so far.


Figures

FIG. 1.
FIG. 1.
Proliferation of NIH 3T3 cells requires MEK/ERK activation. Exponentially growing NIH 3T3 cells were treated with dimethyl sulfoxide (0.2%), with increasing concentrations of U0126 (5 μM, 10 μM, and 20 μM), or with increasing concentrations of PD184352 (5 μM, 10 μM, and 20 μM) on day 0. (A) Cells were lysed at day 2, and Western blotting was used to visualize expression of ERKs (antibodies E1B and ERK1 no. 61) or phosphorylated ERKs. Quantification of phospho-ERK1/2 was performed with light capture. (B) NIH 3T3 cells were plated and treated at day 0 (8 h after the seeding of the cells) as for panel A, and nuclei were counted daily as explained in Materials and Methods. Fold proliferation was calculated by dividing the number of cells counted each day by the number of cells counted at 8 h postplating (day 0).
FIG. 2.
FIG. 2.
ERK1 ablation has no impact on cell proliferation. NIH 3T3 cells were transfected with 3 μg of pBabePuro plasmid and 27 μg of control plasmid or 27 μg pSUPER-ERK1 (sh-ERK1). After selection, cells were plated under conditions of exponential growth. (A) The levels of ERKs and phosphorylated ERKs were evaluated by immunoblotting at 2.5 days postplating as for Fig. 1. The level of actin analyzed by immunoblotting is given for loading normalization. (B) Cells plated on 12-well plates were fixed at 6 h postplating (day 0) and daily up to 4 days postplating. Proliferation was calculated as described for Fig. 1. Data are representative of at least seven independent experiments. Values are the averages and standard deviations of cell counts obtained when cells were plated at 20, 30, and 40 cells per mm2.
FIG. 3.
FIG. 3.
ERK2 ablation slows cell proliferation. NIH 3T3 cells were transfected with 3 μg of pBabePuro plasmid and 27 μg of control plasmid, 27 μg pSUPER-ERK2 (sh-ERK2), or 27 μg pSUPER-ERK2bis plasmids (sh-ERK2bis). After selection, cells were plated under conditions of exponential growth. (A) The levels of ERKs and phosphorylated ERKs were evaluated by immunoblotting at 2.5 days postplating as for Fig. 2. The level of actin analyzed by immunoblotting is given for loading normalization. (B) Cells plated on 12-well plates were fixed and nuclei counted as described for Fig. 2. These data are representative of at least four independent experiments. Values are as described for Fig. 2.
FIG. 4.
FIG. 4.
Double silencing of ERK1 and ERK2 is equally effective as silencing ERK2 alone in slowing cell proliferation. Cells were transfected with 3 μg of pBabePuro plasmid and 27 μg of control plasmid, 13 μg pSUPER-ERK2 plus 13 μg of control plasmid (sh-ERK2), or 13 μg pSUPER-ERK2 plus 13 μg pSUPER-ERK1 plasmids (sh-ERK1+sh-ERK2). After selection, cells were plated under conditions of exponential growth. (A) The levels of ERKs and phosphorylated ERKs were evaluated by immunoblotting at 2.5 days postplating as described for Fig. 2. The level of actin was determined as a control for loading. (B) Cells plated on 12-well plates were fixed and counted as described for Fig. 2. Data are representative of at least four independent experiments. Values are as described for Fig. 2.
FIG. 5.
FIG. 5.
The remaining ERK isoform is overactivated. Cells were transfected with 3 μg of pBabePuro plasmid and 27 μg of control plasmid, 27 μg pSUPER-ERK1 (sh-ERK1), or 27 μg pSUPER-ERK2 (sh-ERK2). After selection, cells were plated at low density for exponential growth (A) or at high densities with serum removal at 24 h prior to stimulation (B and C). The data were generated from one transfection, and hence the levels of ERK1 and ERK2 shown in panels A, B, and C are identical. The invariant level of actin and ARD1 (31 kDa) was used as a loading control in panels B and C. (A) Cells either transfected with control plasmid (sh-control) or lacking ERK1 (sh-ERK1) or ERK2 (sh-ERK2) were lysed at 2.5 days postplating during exponential growth. (B) Control transfected cells (sh-control) and cells lacking ERK1 (sh-ERK1) were stimulated for 1, 3, and 5 h with 10% FCS. (C) Control transfected cells (sh-control) and cells lacking ERK2 (sh-ERK2) were stimulated for 1, 3, and 5 h with 10% FCS. Data are representative of three similar experiments.
FIG. 6.
FIG. 6.
At a constant level of ERK2 activity, ERK1 silencing further slows cell proliferation. NIH 3T3 cells in a 10-cm dish were transfected with a total of 100 μg of plasmid containing 3 μg of pBabePuro plasmid for selection and 97 μg control plasmid (lane 1), 27 μg of pSUPER-ERK2 plasmid and 70 μg of control plasmid (lane 2), 57 μg of pSUPER-ERK2 plasmid and 40 μg of control plasmid (lane 3), or 57 μg of pSUPER-ERK2 plasmid and 40 μg of pSUPER-ERK1 plasmid (lane 4). After selection, cells were plated under conditions of exponential growth. (A) The levels of ERKs and phosphorylated ERKs were evaluated by immunoblotting at 2.5 days postplating as described for Fig. 2. The level of actin was determined for loading normalization. Results of a blot of a 14% SDS-polyacrylamide gel, which minimizes size differences between ERK1 and ERK2, for quantification by light capture are shown. The level of actin is given for loading normalization. (B) The cell proliferation assay and data presentation are as described for Fig. 2. These data are representative of three similar experiments.
FIG. 7.
FIG. 7.
Both ERK1 and ERK2 contribute to stimulate IEG transcription. NIH 3T3 cells in a 10-cm dish were transfected with a total of 100 μg of plasmid containing 3 μg of pBabePuro plasmid for selection. Cells were transfected with 97 μg of control plasmid (sh-control), 27 μg of pSUPER-ERK1 plasmid and 70 μg of control plasmid (sh-ERK1), 27 μg of pSUPER-ERK2 plasmid and 70 μg of control plasmid (sh-ERK2), or 40 μg of pSUPER-ERK1 plasmid and 57 μg of pSUPER-ERK2 plasmid (sh-ERK1+ shERK2). After selection, cells were plated under conditions of high density and arrested 24 h prior to stimulation for 45 min with 10% FCS. (A) The levels of ERK1/2 and phosphorylated ERK1/2 were evaluated by immunoblotting analysis as described for Fig. 2. For the phospho-ERK1/2 immunoblot, short and long exposures are shown. The level of actin is given for loading normalization. (B) Quantification of phosphorylated ERK1 and ERK2 from the blot in panel A after acquisition of the emitted light. For each bar, the levels of phospho-ERK1 and phospho-ERK2 relative to the total phospho-ERK level of stimulated control cells are shown. (C) Quantitative RT-PCR of junB in cells transfected and stimulated as described above (same transfection). The level was measured in triplicate and expressed as a percentage of junB expressed after 45 min in serum-stimulated control-transfected cells. (D) Quantitative RT-PCR of egr1 in the same extracts as for panel C for junB. The median and range from four experiments performed identically are represented in panels C and D. Results in all conditions were statistically lower than the control (P < 0.05 as determined by the Friedman test). Similar results were obtained for the single ablation of ERK1 or ERK2 when NIH 3T3 cells were transfected with 30 μg of plasmid (five additional independent experiments).
FIG. 8.
FIG. 8.
Quantification of the relative levels of ERK1 and ERK2 and the relative levels of activated ERK1 and activated ERK2. HEK293 cells were transfected with plasmids expressing mouse ERK1 or mouse ERK2 that was tagged at the N terminus with the HA epitope or at the C terminus with the VSVG epitope. Extracts from these cells were mixed to load equal quantities of the two isoforms tagged with the same epitope in order to normalize the signal obtained with antibodies that recognize endogenous mouse ERKs in NIH 3T3 cell extracts. (A) Two gels were loaded identically, and the upper blot was revealed with an anti-HA antibody and the lower blot with ERK monoclonal antibody mix 1 as described in Materials and Methods. The first six lanes were loaded with decreasing amount of HEK transfected cell lysate and the last three with increasing quantities of NIH 3T3 cell extracts. (B) As in panel A, two gels were loaded identically, and the upper blot was revealed with an anti-HA antibody and the lower with the ERK polyclonal mix of antibodies (E1B and ERK1 no. 61). Lanes 1, 2, and 5 were loaded with decreasing amounts of HA-ERKs for normalization, and lanes 3 and 4 were loaded with NIH 3T3 cell extracts. (C) Three gels were equally loaded and revealed with either a VSVG antibody (upper blot), anti-ERK monoclonal antibody mix 2 (middle blot), or a polyclonal mix of antibodies (E1B and ERK1 no. 61). The first five lanes were loaded with decreasing amounts of HEK293 cells transfected with ERK-VSVG, whereas the last five lanes were loaded with increasing quantities of NIH 3T3 cell extracts. (D) Quantification of phospho-ERK1 and phospho-ERK2 in increasing amounts of NIH 3T3 extracts of cells stimulated for 45 min with 10% FCS. The ratio of phospho-ERK1 to phospho-ERK2 is indicated for each quantity of NIH 3T3 extract loaded.
FIG. 9.
FIG. 9.
Determination of HA-ERK1- and HA-ERK2-specific kinase activities. HA-ERK1 or HA-ERK2 was immunoprecipitated from increasing volumes of cell lysate obtained from CCL39 cells that stably express HA-ERK1 or HA-ERK2. An in vitro kinase assay using the GST-Elk-1307-428 fusion protein as the substrate was performed on each immunoprecipitate. (A) In the lysates of the kinase assays, the activated forms of HA-ERKs and the phosphorylation of the GST-Elk-1307-428 fusion protein were determined by immunoblotting using the anti-phospho-ERK1/2 and anti-phospho-Elk-1-ser383 antibodies, respectively. (B) The chemiluminescence was measured directly with a Gnome detector from Syngene (United Kingdom). The chemiluminescence corresponding to the phosphorylation of the GST-Elk-1307-428 fusion protein is plotted as a function of the chemiluminescence corresponding to the activated form of HA-ERK1 or HA-ERK2.
FIG. 10.
FIG. 10.
Correlation between the levels of ERK isoforms in brain and their relative phosphorylation. Proteins from mouse brain were extracted in Laemmli sample buffer as described in Materials and Methods. Extracted brain structures: Ch, cerebellar hemisphere; Cb, cerebellum; Sc, superficial cerebrum; Dc, deep cerebrum; Mh, median eminence and hypophyse; Me, medulla; Ol, olfactory bulb; Pi, Pineal gland. The last two lanes are one-third and one-ninth dilutions of superficial cerebrum extract (third lane).

Similar articles

Cited by

References

    1. Adachi, M., M. Fukuda, and E. Nishida. 2000. Nuclear export of MAP kinase (ERK) involves a MAP kinase kinase (MEK)-dependent active transport mechanism. J. Cell Biol. 148849-856. (Erratum, 149:754, 2000.) - PMC - PubMed
    1. Aebersold, D. M., Y. D. Shaul, Y. Yung, N. Yarom, Z. Yao, T. Hanoch, and R. Seger. 2004. Extracellular signal-regulated kinase 1c (ERK1c), a novel 42-kilodalton ERK, demonstrates unique modes of regulation, localization, and function. Mol. Cell. Biol. 2410000-10015. - PMC - PubMed
    1. Agrawal, A., S. Dillon, T. L. Denning, and B. Pulendran. 2006. ERK1−/− mice exhibit Th1 cell polarization and increased susceptibility to experimental autoimmune encephalomyelitis. J. Immunol. 1765788-5796. - PubMed
    1. Aury, J. M., O. Jaillon, L. Duret, B. Noel, C. Jubin, B. M. Porcel, B. Segurens, V. Daubin, V. Anthouard, N. Aiach, O. Arnaiz, A. Billaut, J. Beisson, I. Blanc, K. Bouhouche, F. Camara, S. Duharcourt, R. Guigo, D. Gogendeau, M. Katinka, A. M. Keller, R. Kissmehl, C. Klotz, F. Koll, A. Le Mouel, G. Lepere, S. Malinsky, M. Nowacki, J. K. Nowak, H. Plattner, J. Poulain, F. Ruiz, V. Serrano, M. Zagulski, P. Dessen, M. Betermier, J. Weissenbach, C. Scarpelli, V. Schachter, L. Sperling, E. Meyer, J. Cohen, and P. Wincker. 2006. Global trends of whole-genome duplications revealed by the ciliate Paramecium tetraurelia. Nature 444171-178. - PubMed
    1. Berra, E., E. Benizri, A. Ginouves, V. Volmat, D. Roux, and J. Pouyssegur. 2003. HIF prolyl-hydroxylase 2 is the key oxygen sensor setting low steady-state levels of HIF-1alpha in normoxia. EMBO J. 224082-4090. - PMC - PubMed

Publication types

MeSH terms

Substances

LinkOut - more resources