. 2007 Nov 26;204(12):2837-52.
doi: 10.1084/jem.20071032. Epub 2007 Oct 29.

Hormonal control of the renal immune response and antibacterial host defense by arginine vasopressin

Affiliations

Hormonal control of the renal immune response and antibacterial host defense by arginine vasopressin

Cécilia Chassin et al. J Exp Med. .

Abstract

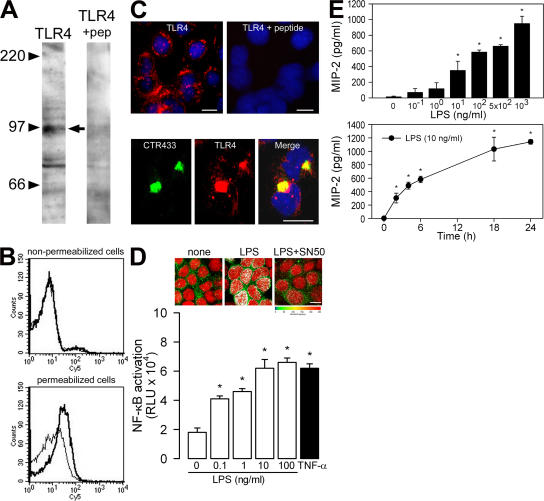
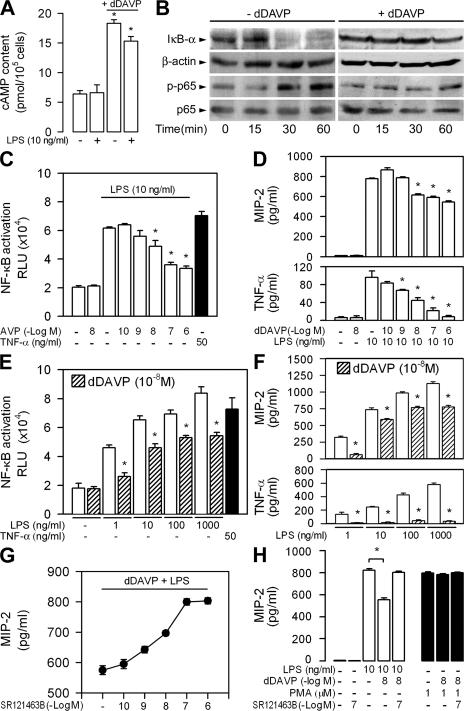
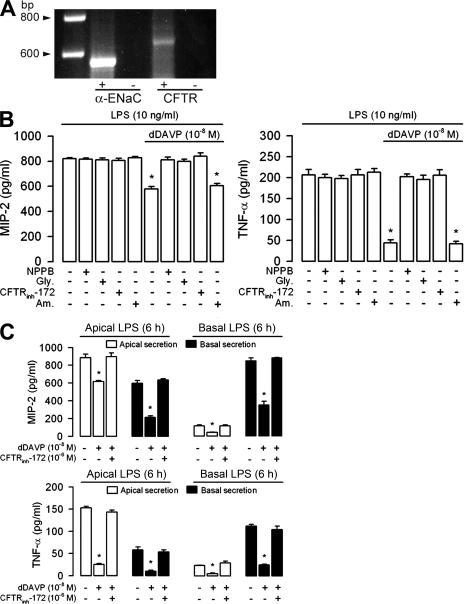
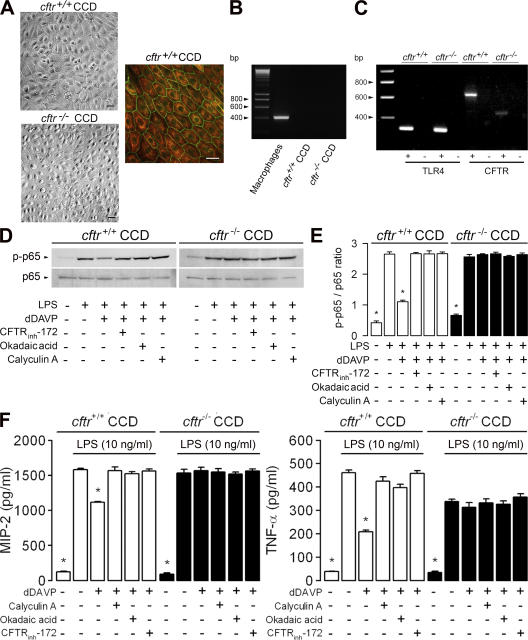
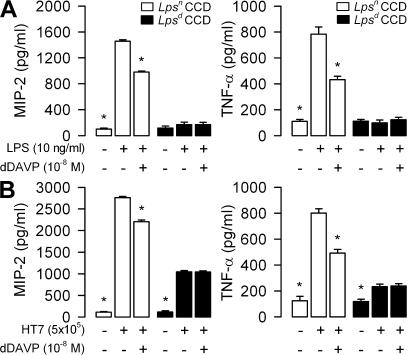
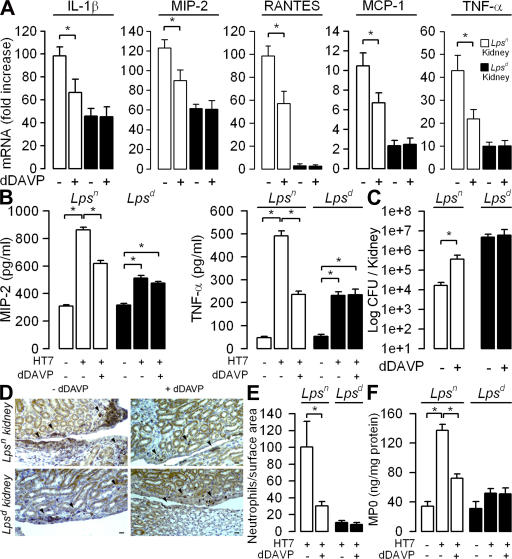
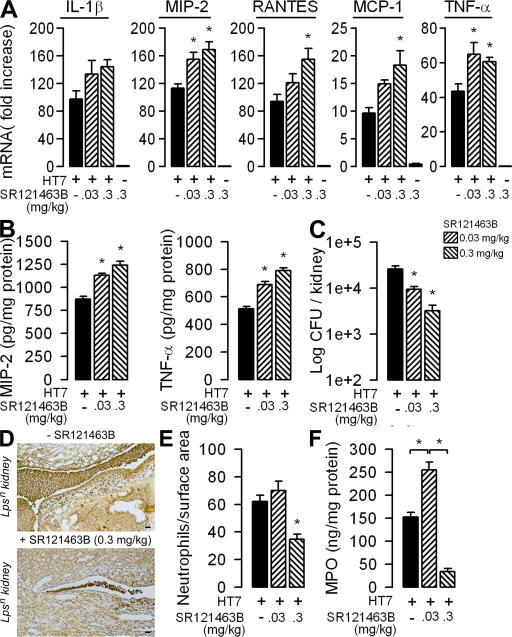
Ascending urinary tract infection (UTI) and pyelonephritis caused by uropathogenic Escherichia coli (UPEC) are very common infections that can cause severe kidney damage. Collecting duct cells, the site of hormonally regulated ion transport and water absorption controlled by vasopressin, are the preferential intrarenal site of bacterial adhesion and initiation of inflammatory response. We investigated the effect of the potent V2 receptor (V2R) agonist deamino-8-D-arginine vasopressin (dDAVP) on the activation of the innate immune response using established and primary cultured collecting duct cells and an experimental model of ascending UTI. dDAVP inhibited Toll-like receptor 4-mediated nuclear factor kappaB activation and chemokine secretion in a V2R-specific manner. The dDAVP-mediated suppression involved activation of protein phosphatase 2A and required an intact cystic fibrosis transmembrane conductance regulator Cl- channel. In vivo infusion of dDAVP induced a marked fall in proinflammatory mediators and neutrophil recruitment, and a dramatic rise in the renal bacterial burden in mice inoculated with UPECs. Conversely, administration of the V2R antagonist SR121463B to UPEC-infected mice stimulated both the local innate response and the antibacterial host defense. These findings evidenced a novel hormonal regulation of innate immune cellular activation and demonstrate that dDAVP is a potent modulator of microbial-induced inflammation in the kidney.


Figures

Figure 1.
Figure 1.
TLR4 expression in CCD mpkCCDcl4 cells. (A) Western blot analysis of mpkCCDcl4 cell lysates revealing a band of the predicted size (∼96 kD; arrow) of TLR4, which was not detected in the presence of an excess of the peptide (+pep) used for immunization. (B) FACS analysis for TLR4 in nonpermeabilized and permeabilized cells. Nonbolded lines correspond to the isotype control. (C) Cellular immunolocalization of TLR4 performed with or without an excess of the peptide used for immunization (top), and colocalization of TLR4 with the Golgi apparatus marker CTR433 (bottom). Nuclei were counterstained with HOECHST 33258. Bars, 10 μm. (D, top) Nuclear translocation of NF-κB p65/RelA in cells stimulated with 10 ng/ml LPS in the presence or absence of 18 μM SN50 for 3 h. Bar, 10 μm. (bottom) Effects of rising concentrations of LPS and 50 ng/ml TNF-α on NF-κB activation in cells transfected with the NF-κB luciferase reporter. (E) Effects of rising concentrations of LPS and time dependency on the secretion of MIP-2. Values are means ± SE from four to seven experiments. *, P < 0.05 versus zero values.
Figure 2.
Figure 2.
Inhibitory effect of dDAVP on LPS-mediated cellular activation. (A) Cell cAMP content in mpkCCDcl4 cells incubated without or with 10−8 M dDAVP, LPS, or dDAVP plus LPS for 6 h. (B) Time-dependent expression of IκB-α and β-actin and phosphorylated (p-p65) and total (p65) NF-κB p65/RelA in cells incubated with LPS (−dDAVP) or LPS plus dDAVP (+dDAVP). (C and D) Effects of rising concentrations of dDAVP on 10 ng/ml LPS–induced cellular activation in mpkCCDcl4 cells transfected with the NF-κB luciferase reporter (C), and on the secretion of MIP-2 and TNF-α (D). (E and F) Effects of 10−8 M dDAVP on 1–1,000 ng/ml LPS–induced cellular activation (E), and on the secretion of MIP-2 and TNF-α (F). TNF-α was used as control for the transactivation experiments. (G and H) Effects of SR121463B on the secretion of MIP-2 6 h after adding dDAVP and LPS. dDAVP and SR121463B had no effect on MIP-2 secretion stimulated by PMA. Results are expressed as means ± SE. *, P < 0.05 versus LPS values.
Figure 3.
Figure 3.
Inhibitors of Ser/Thr protein phosphatases impair the inhibitory effect of dDAVP on the LPS-mediated cytokine secretion. (A) mpkCCDcl4 cells were incubated with or without 10−8 M dDAVP, 10 ng/ml LPS, or dDAVP plus LPS for 6 h. Ser/Thr phosphatase activity was measured in cell homogenates using a synthetic phosphopeptide substrate. Error bars represent the mean phosphate release values ± SE from six separate experiments. (B) The secretion of MIP-2 and TNF-α was measured in the cell supernatants after incubation with or without 10 ng/ml LPS or 10−8 M dDAVP plus LPS for 6 h in the presence or absence of 10 nM calyculin A or okadaic acid. Values are means ± SE from four to seven separate experiments. *, P < 0.05 versus basal and LPS values (A) or versus the other experimental conditions (B).
Figure 4.
Figure 4.
Anion channel inhibitors prevent the inhibitory effect of dDAVP on LPS-mediated cytokine secretion. (A) mpkCCDcl4 cells expressed α-ENaC (564 bp) and CFTR (636 bp) mRNA. + represents reverse-transcribed RNA; − represents non–reverse-transcribed RNA. (B) MIP-2 and TNF-α secretions were measured after incubating cells with or without 10 ng/ml LPS, 10−8 M dDAVP, or dDAVP plus LPS for 6 h in the presence or absence of 10−4 M NPPB, 10−4 M Gly, 10−7 M CFTRinh-172, or 10−5 M amiloride (Am). (C) Apical and basal secretion of MIP-2 and TNF-α measured on confluent cells grown on filters and incubated with 10 ng/ml LPS, LPS plus 10−8 M dDAVP, or LPS plus dDAVP and 10−7 M CFTRinh-172. LPS was added either on the apical (Apical LPS) or basal (Basal LPS) side of the cell layers, dDAVP was added to the basal side of the cell layers, and CFTRinh-172 was added to the apical side of the cell layers. Values are means ± SE from five to eight experiments (B) and from 7 to 10 measurements from three independent experiments (C). *, P < 0.05 versus LPS plus dDAVP values and the other experimental conditions.
Figure 5.
Figure 5.
The inhibitory effect of dDAVP on LPS-stimulated cytokine secretion requires functional CFTR. (A) cftr+/+ and cftr−/− CCDs formed confluent layers of cuboid cells and expressed cytokeratins 8–18 (red) and the tight junction–associated protein ZO-1 (green). Bars, 10 μm. (B) CD45 mRNA (405 bp) expressed in peritoneal macrophages was not detected in cultured cftr+/+ CCDs. (C) Cultured cftr+/+ CCDs and cftr−/− CCDs expressed TLR4 (311 bp) mRNAs. No amplified product of the expected size CFTR (636 bp) was detected in cftr−/− CCDs. + represents reverse-transcribed RNA; − represents non–reverse-transcribed RNA. (D) Western blots analyses of phosphorylated (p-p65) and total (p65) NF-κB p65/RelA after incubation of cftr+/+ and cftr−/− CCDs with or without LPS or LPS plus dDAVP, and with or without CFTRinh-172, okadaic acid, or calyculin A for 60 min (E). Error bars are the mean ratio values (arbitrary units) ± SE of densitometric analyses of phosphorylated over total p65 (n = 3) in the different conditions tested. (F) The secretion of MIP-2 was measured in cftr+/+ CCD and cftr−/− CCD cell supernatants before and after adding LPS or LPS plus dDAVP with or without protein phosphatase and CFTR inhibitors for 6 h. Values are means ± SE from 7 to 11 wells from three to five separate experiments. *, P < 0.05 versus LPS plus dDAVP values and the other experimental conditions.
Figure 6.
Figure 6.
Differential action of dDAVP on LPS- and UPEC-stimulated cytokine secretion in Lpsn and Lpsd CCD cells. Secretion of MIP-2 and TNF-α was measured in confluent cultures of Lpsn and Lpsd CCDs incubated with LPS alone or LPS plus dDAVP for 6 h (A), or incubated with E. coli HT7 isolates (5 × 10⁵ bacteria per well) alone or HT7 plus dDAVP for 3 h (B). Values are means ± SE from five to seven separate wells from three separate experiments under each condition tested. *, P < 0.05 versus LPS or HT7 values (open bars) or HT7 and HT7 plus dDAVP values (shaded bars).
Figure 7.
Figure 7.
Inhibitory action of dDAVP on inflammatory response, bacterial colonization, and neutrophil infiltrates in kidneys of mice challenged with UPECs. dDAVP or isotonic saline was delivered via osmotic minipumps to Lpsn and Lpsd mice. Expression of proinflammatory mediators, production of cytokines, bacterial counts, numbers of infiltrating neutrophils, and MPO activity were determined in kidneys from isotonic saline control (−dDAVP) and dDAVP-treated (+dDAVP) Lpsn (open bars) and Lpsd (shaded bars) mice 24 h after the transurethral inoculation of HT7 isolates. (A) Relative fold increase of each mRNA level compared with that measured in naive mice. (B and C) Production of MIP-2 and TNF-α (B) and bacterial counts (C) in kidneys from HT7-infected Lpsn and Lpsd mice. (D and E) Illustrations (D) and quantification (E) of infiltrating Ly6-G–positive neutrophils (arrowheads) in kidney sections from HT7-infected Lpsn and Lpsd mice pretreated without (−dDAVP) or with dDAVP (+dDAVP). Bars, 50 μm. (F) Levels of MPO activity measured in kidney homogenates from uninfected and HT7-infected Lpsn and Lpsd kidneys treated or not with dDAVP. All values are means ± SE from measurements performed on six to eight different kidneys in each group tested. *, P < 0.05 between groups.
Figure 8.
Figure 8.
The V2R antagonist SR121463B stimulates inflammatory response and promotes bacterial clearance in the kidneys of mice challenged with UPECs. Lpsn mice received intraperitoneal injections of SR121463B (0.03 or 0.3 mg/kg in 100 μl) 6 h before and after the transurethral inoculation of HT7 isolates. The expression of proinflammatory mediators, bacterial counts, numbers of infiltrating neutrophils, and MPO activity were performed 24 h after the transurethral inoculation of HT7 isolates. (A–C) Relative fold increase of each mRNA level of proinflammatory mediator compared with that measured in naive mice (A), production of MIP-2 and TNF-α (B), and bacterial counts (C) in kidneys from untreated and SR121463B-treated Lpsn mice challenged with HT7. (D) Illustrations of neutrophil infiltrates (brown) in untreated (top), and 0.3 mg/kg SR121463B–treated (bottom) Lpsn mice challenged with HT7. Bars, 50 μm. (E and F) Quantification of infiltrating neutrophils (E) and MPO activity (F) in kidneys from HT7-infected Lpsn mice pretreated or not with SR121463B. All values are means ± SE from measurements performed on six to eight different kidneys in each group tested. *, P < 0.05 versus HT7 values and between groups.

References

    1. Brown, P., M. Ki, and B. Foxman. 2005. Acute pyelonephritis among adults: cost of illness and considerations for the economic evaluation of therapy. Pharmacoeconomics. 23:1123–1142. - PubMed
    1. Freedman, A.L. 2005. Urologic diseases in North America Project: trends in resource utilization for urinary tract infections in children. J. Urol. 173:949–954. - PubMed
    1. Pelle, G., S. Vimont, P.P. Levy, A. Hertig, N. Ouali, C. Chassin, G. Arlet, A. Rondeau, and A. Vandewalle. 2007. Acute pyelonephritis represents a risk factor impairing long-term kidney graft function. Am. J. Transplant. 7:899–907. - PubMed
    1. Poltorak, A., X. He, I. Smirnova, M.Y. Liu, C. Van Huffel, X. Du, D. Birdwell, E. Alejos, M. Silva, C. Galanos, et al. 1998. Defective LPS signaling in C3H/HeJ and C57BL/10ScCr mice: mutations in Tlr4 gene. Science. 282:2085–2088. - PubMed
    1. Hagberg, L., R. Hull, S. Hull, J.R. McGhee, S.M. Michalek, and C. Svanborg Eden. 1984. Difference in susceptibility to gram-negative urinary tract infection between C3H/HeJ and C3H/HeN mice. Infect. Immun. 46:839–844. - PMC - PubMed

Publication types

MeSH terms