Comparative Study
. 2008 Jan 1;111(1):453-62.
doi: 10.1182/blood-2007-06-094482. Epub 2007 Oct 29.

Differential impact of mammalian target of rapamycin inhibition on CD4+CD25+Foxp3+ regulatory T cells compared with conventional CD4+ T cells

Affiliations
Comparative Study

Differential impact of mammalian target of rapamycin inhibition on CD4+CD25+Foxp3+ regulatory T cells compared with conventional CD4+ T cells

Robert Zeiser et al. Blood. .

Abstract

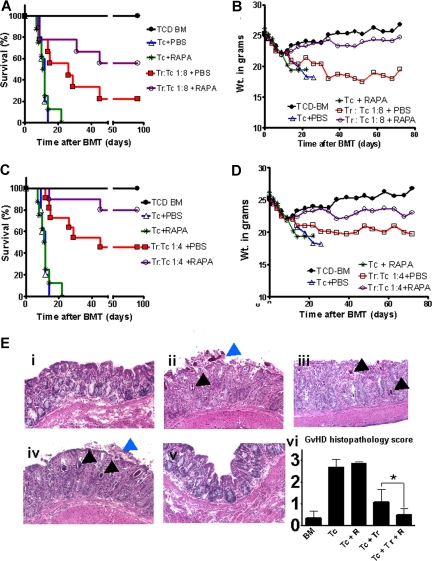
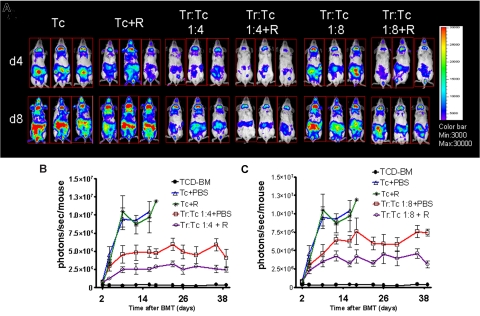
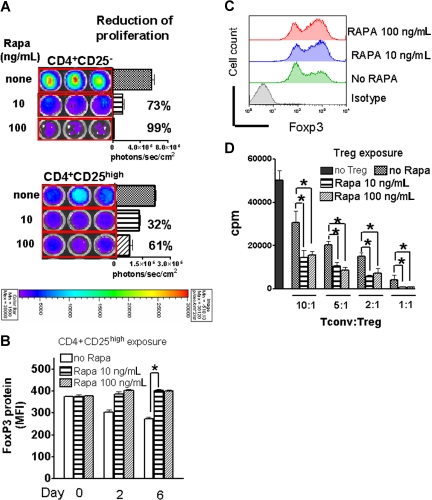
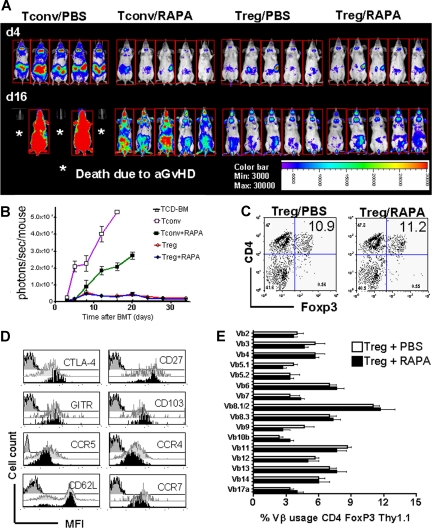
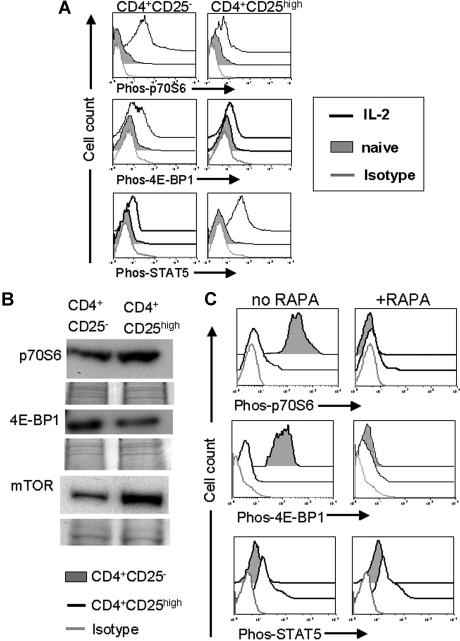
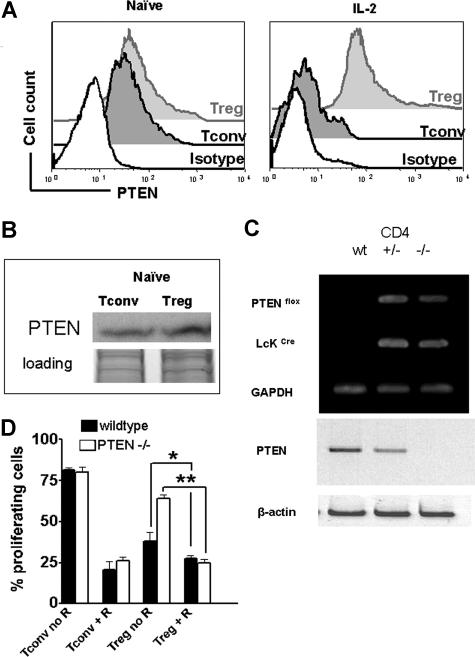
Based on their ability to control T-cell homeostasis, Foxp3(+)CD4(+)CD25(+) regulatory T cells (Tregs) are being considered for treatment of autoimmune disorders and acute graft-versus-host disease (aGVHD). When combining Tregs with the immunosuppressant rapamycin (RAPA), we observed reduced alloreactive conventional T-cell (Tconv) expansion and aGVHD lethality compared with each treatment alone. This synergistic in vivo protection was paralleled by intact expansion of polyclonal Tregs with conserved high FoxP3 expression. In contrast to Tconv, activation of Tregs with alloantigen and interleukin-2 preferentially led to signal transducer and activator of transcription 5 (STAT5) phosphorylation and not phosphatidylinositol 3-kinase (PI3K)/Akt/mammalian target of rapamycin (mTOR) pathway activity. Expression of phosphatase and tensin homolog deleted on chromosome 10 (PTEN), a negative regulator of the PI3K/Akt/mTOR pathway, remained high in Tregs but not Tconv during stimulation. Conversely, targeted deletion of PTEN increased susceptibility of Tregs to mTOR inhibition by RAPA. Differential impact of RAPA as a result of reduced usage of the mTOR pathway in Tregs compared with conventional T cells explains the synergistic effect of RAPA and Tregs in aGVHD protection, which has important implications for clinical trials using Tregs.


Figures

Figure 1
Figure 1
Combined rapamycin/Treg treatment had a synergistic protective effect against aGvHD. BALB/c mice were injected with 5 × 10⁶ TCD-BM cells alone (●) or together with 1.6 × 10⁶ CD4+/CD8+ (1:4) T cells and Tregs when indicated (both H-2kq) after lethal irradiation at 800 cGy. (A) Percentage survival of animals receiving conventional T cells (Tconv) + PBS (△, n = 10), T cells and rapamycin (RAPA) 0.5 mg/kg (*, n = 10), Treg:Tconv (1:8) + PBS (□, n = 10), or Treg:Tconv (1:8) + RAPA (○, n = 10). The combination of Tregs with RAPA compared with Tregs with PBS improves survival (○ versus □, P = .003). Survival data from 2 independent experiments are combined. (B) Weight change of animals in the different groups. Animals receiving Treg:Tconv (1:8) in combination with RAPA compared with PBS experience less-pronounced weight loss and recover to their baseline weight. (C) Survival of animals receiving conventional T cells (Tconv) only (△, n = 10), Tconv and RAPA 0.5 mg/kg (*, n = 10), Treg:Tconv (1:4) + PBS (□, n = 10), or Treg:Tconv (1:4) + RAPA (○, n = 10). The combination of Tregs with RAPA compared with Tregs with PBS improves survival (○ versus □, P = .007). Survival data from 2 independent experiments are combined. (D) Animals receiving Treg:Tconv (1:4) in combination with RAPA compared with PBS experience less weight loss after transplantation. (E) Twelve days after transplantation, 5 mice from each group were killed and samples of liver, small bowel, and large bowel were analyzed for evidence of pathologic damage. Hematoxylin and eosin stains of colon tissue obtained from these mice are shown. Tissue section from the colon of mice receiving TCD-BM (i), with Tconv (ii), Tconv and RAPA (0.5 mg/kg) (iii), Treg:Tconv (1:8) + PBS (iv), Treg:Tconv (1:8) + RAPA (v). Colon tissue from TCD-BM (i) and Treg:Tconv (1:8) + RAPA (v) displays intact crypts with goblet cells. The other groups have crypt abscesses (black arrows), sloughing of the colonic mucosa (blue arrows), destruction of the crypt, and loss of goblet cells. (vi) Cumulative GVHD histopathology scoring for large bowel, small bowel, and livers of animals from the indicated groups, *P < .05.
Figure 2
Figure 2
RAPA/Tregs protected from aGVHD by reducing alloreactive T-cell expansion in vivo. (A) Single timepoints showing the expansion of luciferase transgenic (luc+) donor T cells in 3 representative BALB/c mice (of 10 animals per group) receiving T cells in combination with Tregs at different ratios (1:4 and 1:8) combined with RAPA as indicated. T-cell expansion is significantly reduced when Tregs are combined with RAPA (column 3 vs 4 and 5 vs 6 from the left). (B) Expansion of luciferase-labeled T cells as quantified in emitted photons over total body area at serial timepoints after BMT. BLI signal intensity of mice receiving TCD-BM (●, n = 10), with T cells (△, n = 15), T cells and RAPA 0.5 mg/kg (*, n = 10), Treg:T cells (1:4) + PBS (□, n = 12) Treg:T cells (1:4) + RAPA (○, n = 12). Signal intensity is significantly higher in animals receiving Treg:T cells (1:4) + PBS compared with Treg:T cells (1:4) + RAPA (□ vs ○, P < .05). (C) BLI signal intensity of mice receiving TCD-BM (●, n = 10), with T cells (△, n = 15), T cells and RAPA 0.5 mg/kg (*, n = 10), Treg:T cells (1:8) + PBS (□, n = 12) Treg:T cells (1:9) + RAPA (○, n = 12). Signal intensity was significantly higher in animals receiving Treg:T cells (1:8) + PBS compared with Treg:T cells (1:8) + RAPA (□ vs ○, P < .05).
Figure 3
Figure 3
RAPA inhibited Treg expansion less than Tconv and preserved suppressive activity and Foxp3 expression. (A) In vitro expansion of luciferase transgenic CD4+CD25high or CD4+CD25 T cells (C57BL/6) in the presence of CD3/CD28 stimulation, IL-2 (100 IU/mL), for 48 hours in complete media (cRPMI) and the indicated RAPA (R) doses. Percentages represent the relative reduction compared with the absence of RAPA (100%). One representative experiment of 3 independent experiments is shown. (B) Mean fluorescence intensity (MFI) for Foxp3 surface expression of CD4+CD25high cells at different timepoints during stimulation as described in panel A is quantified in the presence or absence of RAPA (*P < .05). (C) A representative histogram on day 6 of culture for the 3 different culture conditions described in panel A is shown. (D) Suppressive activity of Tregs recovered from the respective cultures. Thymidine incorporation of conventional T cells is significantly reduced when Tregs are included in the culture. Tregs derived from RAPA-containing cultures are more suppressive in vitro (*P < .05). One representative proliferation analysis of 3 independent experiments is shown.
Figure 4
Figure 4
RAPA allows for polyclonal Treg expansion in vivo. (A) Expansion of luc+ Tconv (CD4+CD25) or luc+ Tregs as shown for 5 representative animals of each group in the presence or absence of RAPA (1.5 mg/kg) on days 4 and 16 after BMT (C57BL/6 → BALB/c). Addition of RAPA reduces the expansion of luc+ Tconv (first vs second column of 5 animals from left), whereas expansion of luc+ Tregs is not significantly affected (third vs fourth column of 5 animals from left). (B) Expansion of luciferase-labeled T cells as quantified in emitted photons over total body area at serial timepoints after BMT. BLI signal intensity of mice receiving TCD-BM (△, n = 10), with luc+ T cells with PBS (□, n = 10) or RAPA 1.5 mg/kg (■, n = 10), luc+ Treg with PBS (○, n = 10) or RAPA 1.5 mg/kg (●, n = 10). Signal intensity is significantly higher in animals receiving T cells + PBS compared with T cells + RAPA (□ vs ■, * P < .05). (C) Frequency of splenic CD4+FoxP+ T cells on day 5 after transplantation is not different when PBS compared with RAPA is given in vivo. One representative FACS analysis of 3 independent experiments is shown. (D) BALB/c mice were given 5 × 10⁶ TCD-BM together with 5 × 10⁵ Tregs (C57BL/6) after lethal irradiation with 800 cGy and were injected with PBS or RAPA (1.5 mg/kg) daily. Expression of the indicated markers on splenic Thy1.1+CD4+CD25+ on day 5 after transplantation is shown. Black histogram, recipient received Treg + PBS. Light gray histogram, Treg + RAPA. Dark gray histogram, Isotype control Ab. (E) TCR Vβ usage of Thy1.1+CD4+CD25+ on day 30 after transplantation in BALB/c recipients is shown.
Figure 5
Figure 5
Preferential STAT-5 pathway usage in Tregs predicted resistance to mTOR inhibition. (A) The amount of phosphorylated p70S6, 4E-BP1, and STAT-5 was quantified by phospho-flow analysis within Tconv cells (CD4CD25, left panel) and Tregs (CD4CD25high, right panel). T cells were isolated after 48 hours of IL-2 (100 IU/mL) stimulation. The amount of phosphorylated protein as measured in MFI increased significantly for p70S6, 4E-BP1 in Tconv (4 vs 172, and 11 vs 94, P < .001), but not in Tregs. MFI for phospho-STAT5 increases in Tregs in response to IL-2 (9 vs 103, P < .001). (B) Total protein expression in naive CD4+CD25high or CD4+CD25 T cells isolated from C57BL/6 mice. Expression of p70S6 and mTOR qA increased in Tregs compared with CD4+CD25 T cells. (C) The amount of phosphorylated p70S6, 4E-BP1, and STAT-5 is quantified by phospho-flow analysis within Tconv cells (CD4CD25, filled gray histogram) and Treg cells (CD4CD25high, black solid line) both on C57BL/6 background. T cells were isolated after 48 hours of IL-2 (100 IU/mL) and irradiated (30 Gy, γ-irradiation) allogeneic CD11c+ APC (BALB/c) stimulation. The amount of phosphorylated protein as measured in MFI increases significantly more in Tconv compared with Treg for p70S6, 4E-BP1 (343 vs 16, and 1035 vs 10, P < .001) in response to alloantigen and IL-2. Addition of RAPA (10 ng/mL) abrogates phosphorylation of p70S6 and 4E-BP1 (right panel). MFI for phospho-STAT5 remains constant in Tregs when RAPA is added (29 vs 32, NS).
Figure 6
Figure 6
Tregs display high PTEN expression levels during stimulation and PTEN deficiency partially antagonizes resistance of Tregs toward RAPA. (A) Levels of PTEN protein expression are analyzed by FACS for naive (left histogram) or activated (right histogram) Tconv (dark gray-filled histogram) and Tregs (light gray-filled histogram) cells. Activation was by allo-Ag (CD11c+ H-2kd, 30 Gy γ-irradiation) and IL-2 (100 IU/mL) for 48 hours. The black open histogram represents the isotype control. MFI for PTEN is higher in Tregs compared with Tconv after activation (241 vs 82, P < .001). (B) Western blot analysis demonstrates that Treg cells display slightly higher amounts of PTEN protein compared with Tconv cells while both were in the naive state. (C) Specific recombination at the PTEN locus in the presence of Cre is shown by PCR amplification of genomic DNA isolated from CD4 + T cells from Crenegative (+/+), Ptenflox/+Cre+ (+/−), and Ptenflox/floxCre+ (−/−) littermates. Western blot analysis demonstrated absence of PTEN in Ptenflox/floxCre+ (−/−) mice. (D) Percentage of proliferating wild-type (formula image) or PTEN-deficient (formula image) Tconv or Treg after 48-hour stimulation with (CD11c+ H-2kd, 30 Gy γ-irradiation) and IL-2 (100 IU/mL), in the presence or absence of RAPA (R, 10 ng/mL) as indicated (*P < .05; **P < .01). Proliferation was assessed by serial CFSE dilution.
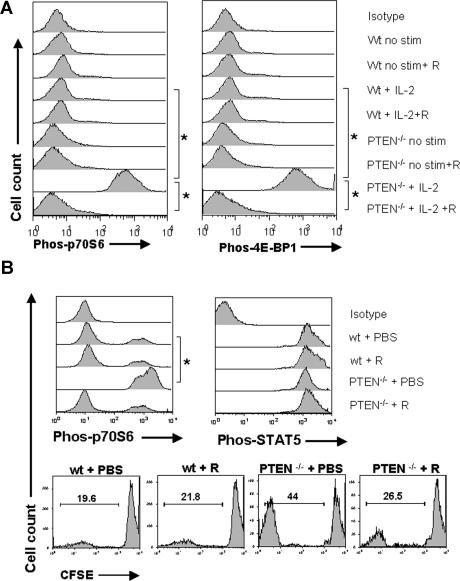
Figure 7
Figure 7
PTEN deficiency reversed low mTOR pathway usage and renders Tregs sensitive to RAPA. (A) Treg cells were isolated after 48 hours of culture. Where indicated, IL-2 (100 IU/mL) and/or RAPA (10 ng/mL) was present in the culture. The amount of phosphorylated p70S6 and 4E-BP1 was quantified by phospho-flow analysis within wt or PTEN−/− Tregs. The amount of phosphorylated protein as measured in MFI was significantly higher for phospho-p70S6 (left panel) phospho-4E-BP1 (right panel) in PTEN−/− compared with wt Treg cells (* P < .01). Addition of RAPA (10 ng/mL) to the culture reduced the amount of phospho-p70S6 and phospho-4E-BP1 in PTEN−/− Treg cells. (B) BALB/c mice were given 5 × 10⁶ TCD-BM together with 5 × 10⁵ wt or PTEN−/− Treg (C57BL/6) after lethal irradiation with 800 cGy and were injected with PBS or RAPA (1.5 mg/kg) daily. The amount of phospho-p70S6, phospho-STAT5 in wt, or PTEN−/− donor type Treg cells (H-2kb) is displayed (*P < .01). Percentage of dividing donor type (H-2kb) CFSE labeled Tregs was higher in PTEN−/− donors compared with wt donors (44% vs 19.6%, P < .05). Increased expansion of PTEN−/− Tregs was antagonized when the recipients were treated with RAPA (44% vs 26.5%, P < .05).

References

    1. Sakaguchi S. Naturally arising CD4(+) regulatory T cells for immunologic self-tolerance and negative control of immune responses. Annu Rev Immunol. 2004;22:531–562. - PubMed
    1. Horwitz DA, Gray JD, Zheng SG. The potential of human regulatory T cells generated ex vivo as a treatment for lupus and other chronic inflammatory diseases. Arthritis Res. 2002;4:241–246. - PMC - PubMed
    1. Zeiser R, Nguyen VH, Beilhack A, et al. Inhibition of CD4+CD25+ regulatory T cell function by calcineurin dependent interleukin-2 production. Blood. 2006;108:390–399. - PMC - PubMed
    1. Wu Y, Borde M, Heissmeyer V, et al. FOXP3 controls regulatory T cell function through cooperation with NFAT. Cell. 2006;126:375–387. - PubMed
    1. Ho L, Crabtree G. A Foxy tango with NFAT. Nat Immunol. 2006;7:906–908. - PubMed

Publication types

MeSH terms