. 2007 Nov;130(5):513-24.
doi: 10.1085/jgp.200709795.

Drosophila bestrophin-1 chloride current is dually regulated by calcium and cell volume

Affiliations

Drosophila bestrophin-1 chloride current is dually regulated by calcium and cell volume

Li-Ting Chien et al. J Gen Physiol. 2007 Nov.

Abstract

Mutations in the human bestrophin-1 (hBest1) gene are responsible for Best vitelliform macular dystrophy, however the mechanisms leading to retinal degeneration have not yet been determined because the function of the bestrophin protein is not fully understood. Bestrophins have been proposed to comprise a new family of Cl(-) channels that are activated by Ca(2+). While the regulation of bestrophin currents has focused on intracellular Ca(2+), little is known about other pathways/mechanisms that may also regulate bestrophin currents. Here we show that Cl(-) currents in Drosophila S2 cells, that we have previously shown are mediated by bestrophins, are dually regulated by Ca(2+) and cell volume. The bestrophin Cl(-) currents were activated in a dose-dependent manner by osmotic pressure differences between the internal and external solutions. The increase in the current was accompanied by cell swelling. The volume-regulated Cl(-) current was abolished by treating cells with each of four different RNAi constructs that reduced dBest1 expression. The volume-regulated current was rescued by transfecting with dBest1. Furthermore, cells not expressing dBest1 were severely depressed in their ability to regulate their cell volume. Volume regulation and Ca(2+) regulation can occur independently of one another: the volume-regulated current was activated in the complete absence of Ca(2+) and the Ca(2+)-activated current was activated independently of alterations in cell volume. These two pathways of bestrophin channel activation can interact; intracellular Ca(2+) potentiates the magnitude of the current activated by changes in cell volume. We conclude that in addition to being regulated by intracellular Ca(2+), Drosophila bestrophins are also novel members of the volume-regulated anion channel (VRAC) family that are necessary for cell volume homeostasis.


Figures

Figure 1.
Figure 1.
Native Drosophila S2 Ca2+-activated Cl currents are sensitive to osmotic pressure. (A) Time course of typical S2 endogenous Ca2+-activated Cl currents (CaCCs). Whole cell patch clamping was initiated in Drosophila S2 cells with isosmotic (320 mosmol kg−1) intracellular (∼4.5 μM free Ca2+) and external solutions. Voltage ramps from −100 to +100 mV were given from a holding potential of 0 mV at 10-s intervals. After the CaCC had reached a plateau amplitude, the bath was replaced with a hyperosmotic external solution (422 mosmol kg−1 by addition of mannitol). (B) Current–voltage relationship of the CaCC current measured at the beginning (open triangle), the plateau (open square), and after hyperosmotic shock (open circle). Internal solution (in mM) was 165 CsCl, 8 MgCl2, 10 Ca-EGTA, 10 HEPES, pH 7.4. External solution: 150 NaCl, 1 MgCl2, 2 CaCl2, 10 HEPES, pH 7.4, 20 mannitol (320 msomol kg−1).
Figure 2.
Figure 2.
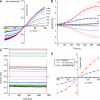
Drosophila S2 cells express endogenous osmotically activated Cl currents. (A and B) Time-dependent activation of the osmotically activated Cl currents in S2 cells. (A) Traces of a typical S2 osmotically activated Cl current recorded by voltage ramps from −100 to +100 mV at 10-s intervals after establishing whole-cell recording with Δ20 mosmol kg−1 (intracellular solution: nominally 0 Ca2+ I320; external solution: E300). (B) Time course of the osmotically activated Cl currents measured at −100 mV (open symbols) and +100 mV (solid symbols) at Δ40 mosmol kg−1 (squares, n = 9), Δ20 mosmol kg−1 (triangles, n = 13), and Δ0 mosmol kg−1 (circles, n = 6). (C) Current traces of a typical osmotically activated (Δ20 mosmol kg−1) Cl current in response to voltage steps (20 mV intervals from −100 to +100 mV) after the ramp current had reached a peak (∼4 min). (D) Steady-state current–voltage relationship with Δ40 mosmol kg−1 (n = 9), Δ20 mosmol kg−1 (n = 16), and Δ0 mosmol kg−1 (n = 5). All averaged data are represented as mean ± SEM.
Figure 3.
Figure 3.
Drosophila S2 osmotically activated Cl currents are correlated with cell swelling. (A) Time courses of the increase in cell volume (open triangles) and the Cl current amplitude after patch break at +100 mV (solid squares) with Δ20 mosmol kg−1 (n = 3). The change in cell volume was calculated as a percentage of the cell volume ∼30 s before patch break. The first data point shown is immediately after patch break. Current measurements were begun after cell capacitance and series resistance were measured, ∼20 s after patch break. (B) Mean current amplitudes at +100 mV at the onset of whole cell recording (filled bars) and after the currents had reached a peak (open bars) and the corresponding cell volume increase (hatched bars) with Δ40 mosmol kg−1, Δ20 mosmol kg−1, and Δ0 mosmol kg−1. Cell volume change is expressed as percent increase in cell volume from the initiation of whole cell recording to ∼5 min after patch break when the currents had approached a steady value. For zero osmotic pressure, the cell volume change was measured 5 min after the initiation of whole cell recording. (mean ± SEM). *, significantly different from control at P < 0.01. Solutions were the same as used in Fig. 2.
Figure 4.
Figure 4.
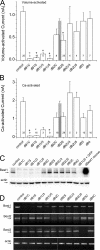
RNAi inhibition of the native S2 volume-activated Cl currents. S2 cells were treated with control dsRNA (from a mammalian intron) or Drosophila bestrophin subtype-specific RNAi before patch clamping at day 6. Mean amplitudes of Cl currents at +100 mV were measured for the (B) Ca-activated currents (∼40 μM free Ca2+ i, isosmotic solutions, open bars) and the (A) volume-regulated currents (E300, nominally 0 Ca2+ i I320, Δ20 mosmol kg−1, red bars) after the currents had reached peak amplitude 4–5 min after patch break. (mean ± SEM). *, significantly different from control at P < 0.01. +, significantly different from control at P < 0.02. The gray bars show the mean current amplitudes of cells treated with dB2S or dB2C for which Western blot data were available to show that dBest1 protein levels were close to control. Some of the CaCC data for dB1S, dB1C, dB2C, dB2S, dB3C, and dB4C have previously been published (Chien et al., 2006). (C) Effects of RNAi on dBest1 protein expression. S2 cells treated 6 d earlier with the indicated RNAi constructs were extracted with SDS and the Western blot was probed with dBest1 antibody. (D) RT-PCR of bestrophin transcripts from S2 cells treated with different RNAi constructs. RT-PCR was performed using the primers described in Materials and methods. RNA was extracted 6 d after RNAi treatment for dBest1 and dBest2 and 2 d after RNAi treatment for dBest3. The actin gel was composited from two different gels that were run in parallel (lanes 1–6 are from one gel and 7–11 from the second). The white line indicates that intervening lanes have been spliced out.
Figure 5.
Figure 5.
Rescue of Ca-activated and volume-regulated currents. Cells were treated with dB1U5 RNAi for ∼4 d and then transfected with either GFP alone (A and C) or GFP + dBest1 (B and D) and recorded 18–24 h later. (A–D) Typical I-V curves for VRAC (A and B) and CaCC (C and D) immediately after patch break (black) and after the current had reached maximum (red, ∼2–4 min after patch break). (A and B) VRACs were recorded with nominally 0 Ca2+ internal solution (I320) and E300 extracellular solution. (C and D) CaCCs were recorded with ∼4.5 μM internal free Ca and isosmotic (300 mosmol kg−1) solutions. (E) Time course of activation of VRAC current after patch break of a typical dBest1-rescued cell. (F) Average amplitude (mean ± SEM) of currents at +100 mV ∼4–5 min after patch break corresponding to the conditions in A–D. *, significantly different from GFP alone, P < 0.01.
Figure 6.
Figure 6.
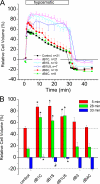
Regulatory volume decrease is inhibited by knockdown of dBest1. S2 cells were treated with RNAi specific to each Drosophila bestrophin subtype as described in Materials and methods for 6 d before quantification of RVD. RNAi-treated cells were pre-incubated in Drosophila saline (330 mosmol kg−1) for 15 min before imaging. The Drosophila saline was replaced by a diluted solution of the same saline (1:1 with H2O, 166 mosmol kg−1) 1 min after the initiation of imaging. Cells were monitored by time lapse imaging for 30 min and cell volume was quantified with MetaMorph as described in Materials and methods. (A) Time course of increase in cell volume. Cell volumes were normalized to the initial volume and the time course of increase in cell volume (%) plotted as mean ± SEM. (B) Mean cell volume increase (%) near peak of cell swelling (red bars, ∼4 min in hyposmotic solution), at the end of RVD (green bars, ∼27 min in hyposmotic solution), and ∼3 min after returning to isomotic solution (blue bars). *, significantly different from control at P < 0.01; #, significantly different from control at P < 0.05.
Figure 7.
Figure 7.
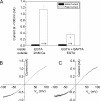
Volume-activated Cl currents are Ca2+ independent. (A) Average amplitudes of S2 volume-activated Cl currents at +100 mV at the onset of whole cell recording (filled bars) and after the currents had reached peak values (open bars) with Δ20 mosmol kg−1. Bars on the left were recorded in the normal solutions with 2 mM extracellular Ca2+ (E300) and 10 mM intracellular EGTA (I320). Cells on the right were recorded with I320 intracellular solution with 5 mM BAPTA added and a nominally 0 Ca2+ extracellular solution prepared by substituting external Ca2+ with equimolar of Mg2+ and adding 1 mM EGTA. *, significantly different from control at P < 0.01. (B) I-V curve from a voltage ramp for current corresponding to the left bars in A. (C) I-V curve for current corresponding to right bars in A.
Figure 8.
Figure 8.
The S2 Ca-activated Cl current is not correlated with cell swelling. (A) Mean current amplitudes at +100 mV at the onset of whole cell recording (filled bars) and after the currents had reached steady states (open bars) in cells recorded with high intracellular Ca2+ solution (4.5 μM) or nominally Ca2+-free (<20 nM) intracellular solution. (B) Changes in cell volume (%) after the currents had reached steady state in cells recorded with high intracellular Ca2+ solution (4.5 μM) or nominally Ca2+-free (<20 nM) intracellular solution. Cell volumes were normalized to the basal cell volume measured at the initiation of the whole cell patch clamping. The data are represented as mean ± SEM. *, significantly different from high Ca2+ at P < 0.01.

Similar articles

Cited by

References

    1. Adorante, J.S. 1995. Regulatory volume decrease in frog retinal pigment epithelium. Am. J. Physiol. 268:C89–C100. - PubMed
    1. Allikmets, R., J.M. Seddon, P.S. Bernstein, A. Hutchinson, A. Atkinson, S. Sharma, B. Gerrard, W. Li, M.L. Metzker, C. Wadelius, et al. 1999. Evaluation of the Best disease gene in patients with age-related macular degeneration and other maculopathies. Hum. Genet. 104:449–453. - PubMed
    1. Altamirano, J., M.S. Brodwick, and F.J. Alvarez-Leefmans. 1998. Regulatory volume decrease and intracellular Ca2+ in murine neuroblastoma cells studied with fluorescent probes. J. Gen. Physiol. 112:145–160. - PMC - PubMed
    1. Chen, B., G. Nicol, and W.K. Cho. 2007. Role of calcium in volume-activated chloride currents in a mouse cholangiocyte cell line. J. Membr. Biol. 215:1–13. - PubMed
    1. Chien, L.T., Z.R. Zhang, and H.C. Hartzell. 2006. Single Cl− channels activated by Ca2+ in Drosophila S2 cells are mediated by bestrophins. J. Gen. Physiol. 128:247–259. - PMC - PubMed

Publication types