. 2007 Nov;56(11):3770-83.
doi: 10.1002/art.23023.

Deficiency of the type I interferon receptor protects mice from experimental lupus

Affiliations

Deficiency of the type I interferon receptor protects mice from experimental lupus

Dina C Nacionales et al. Arthritis Rheum. 2007 Nov.

Abstract

Objective: Systemic lupus erythematosus (SLE) is diagnosed according to a spectrum of clinical manifestations and autoantibodies associated with abnormal expression of type I interferon (IFN-I)-stimulated genes (ISGs). The role of IFN-I in the pathogenesis of SLE remains uncertain, partly due to the lack of suitable animal models. The objective of this study was to examine the role of IFN-I signaling in the pathogenesis of murine lupus induced by 2,6,10,14-tetramethylpentadecane (TMPD).

Methods: IFN-I receptor-deficient (IFNAR(-/-)) 129Sv mice and wild-type (WT) 129Sv control mice were treated intraperitoneally with TMPD. The expression of ISGs was measured by real-time polymerase chain reaction. Autoantibody production was evaluated by immunofluorescence and enzyme-linked immunosorbent assay. Proteinuria and renal glomerular cellularity were measured and renal immune complexes were examined by immunofluorescence.

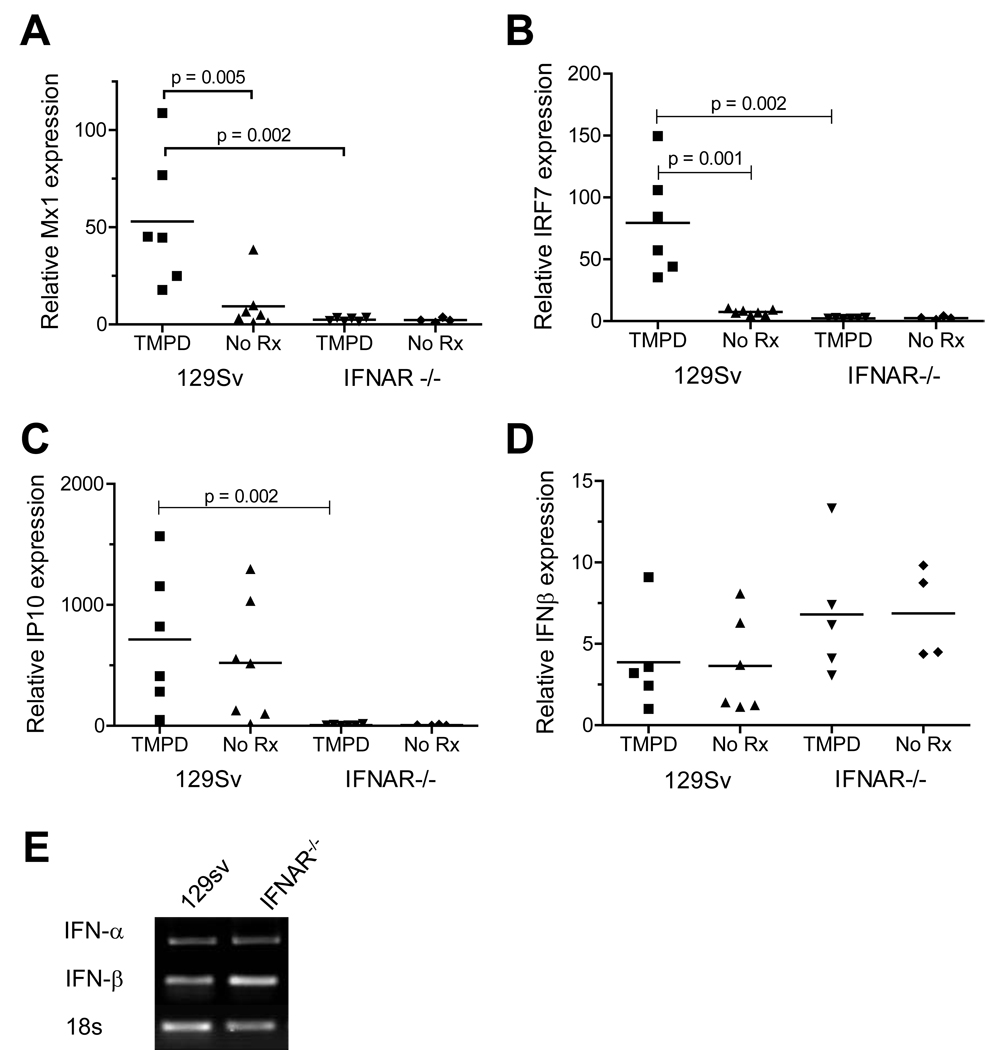
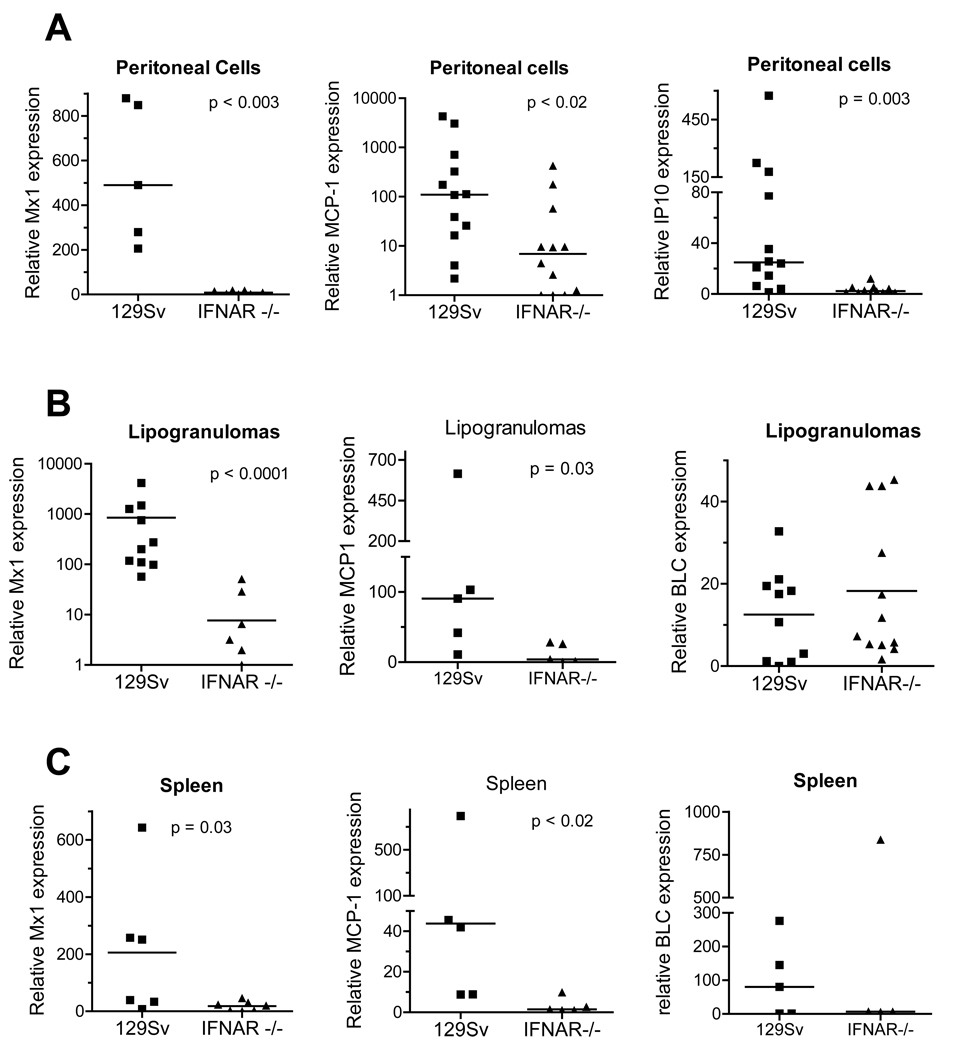
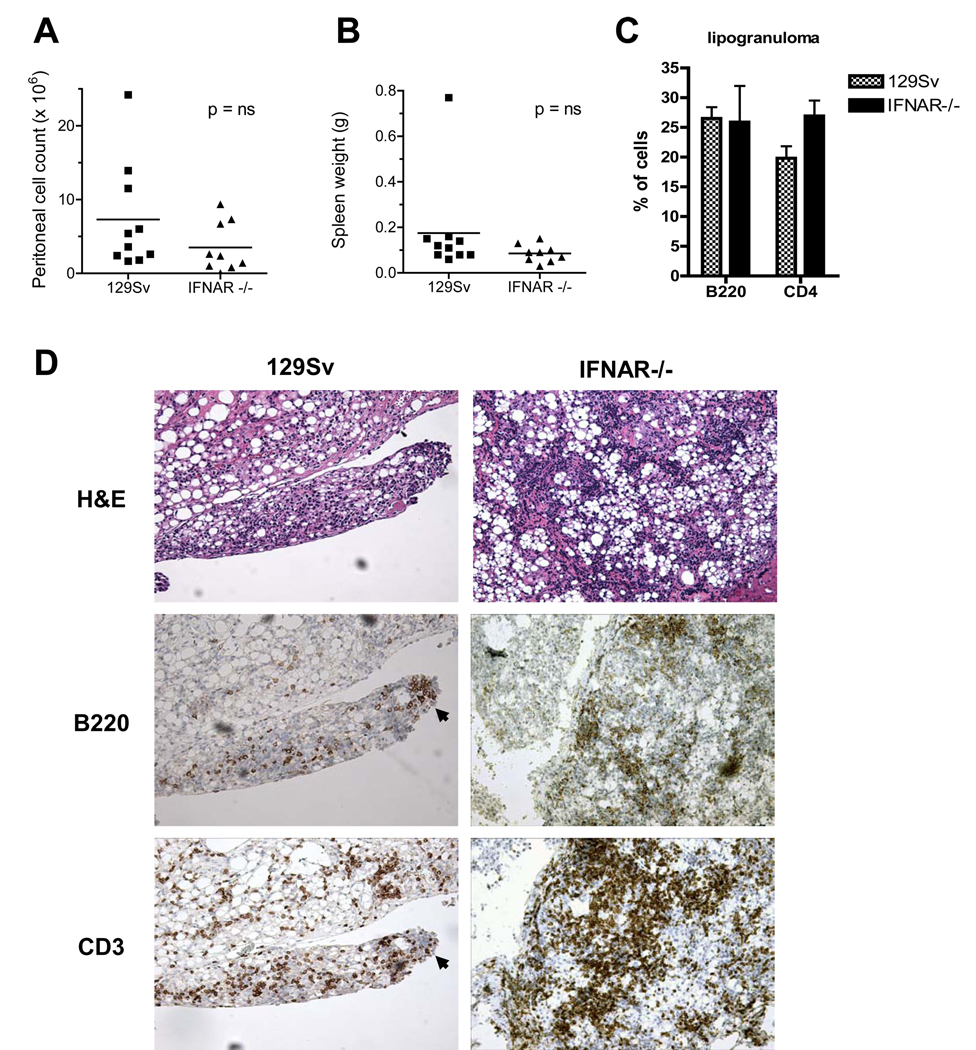
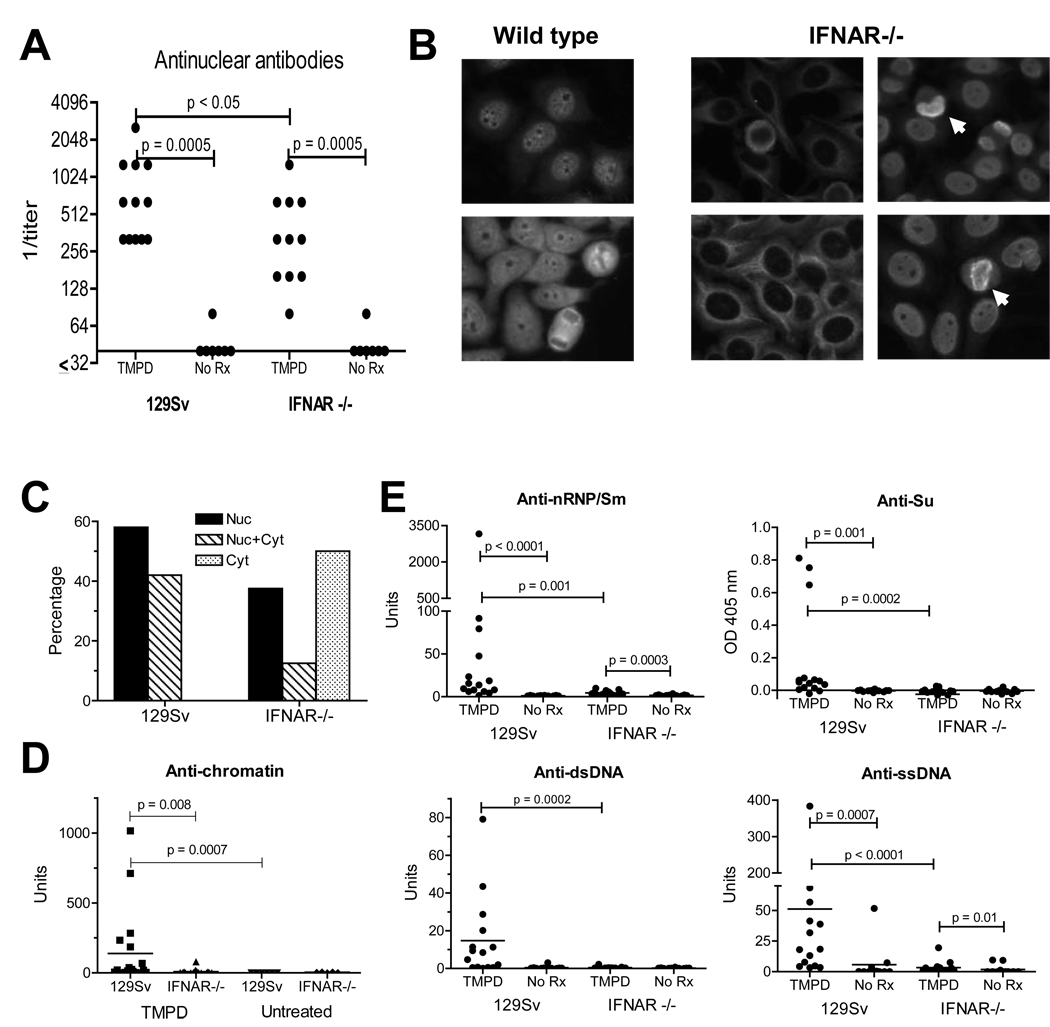
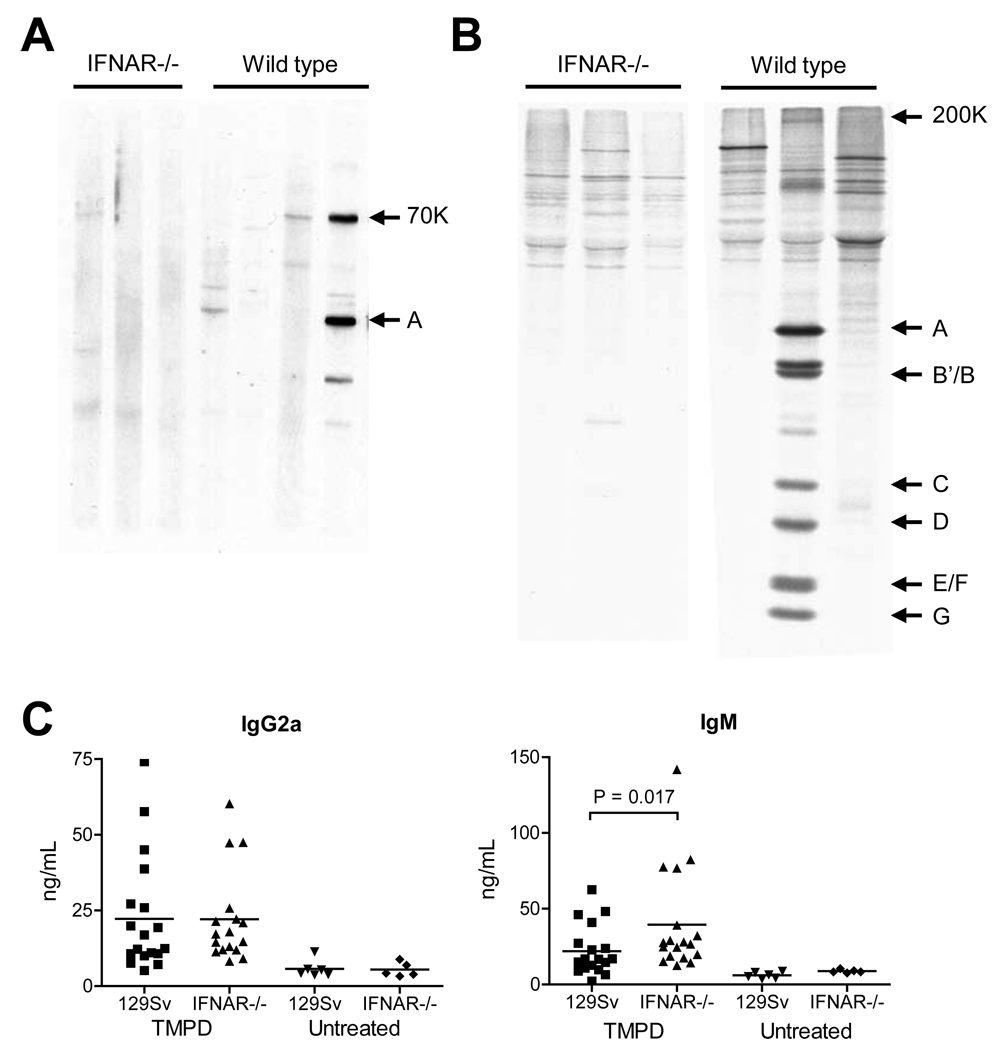
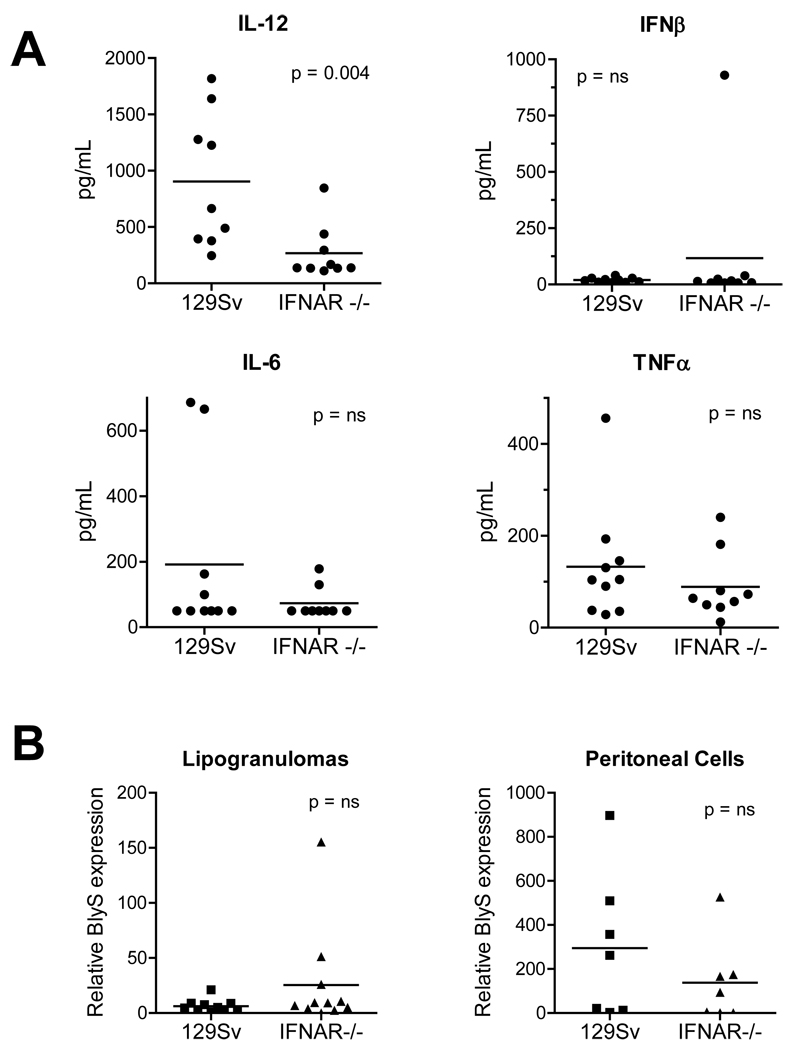
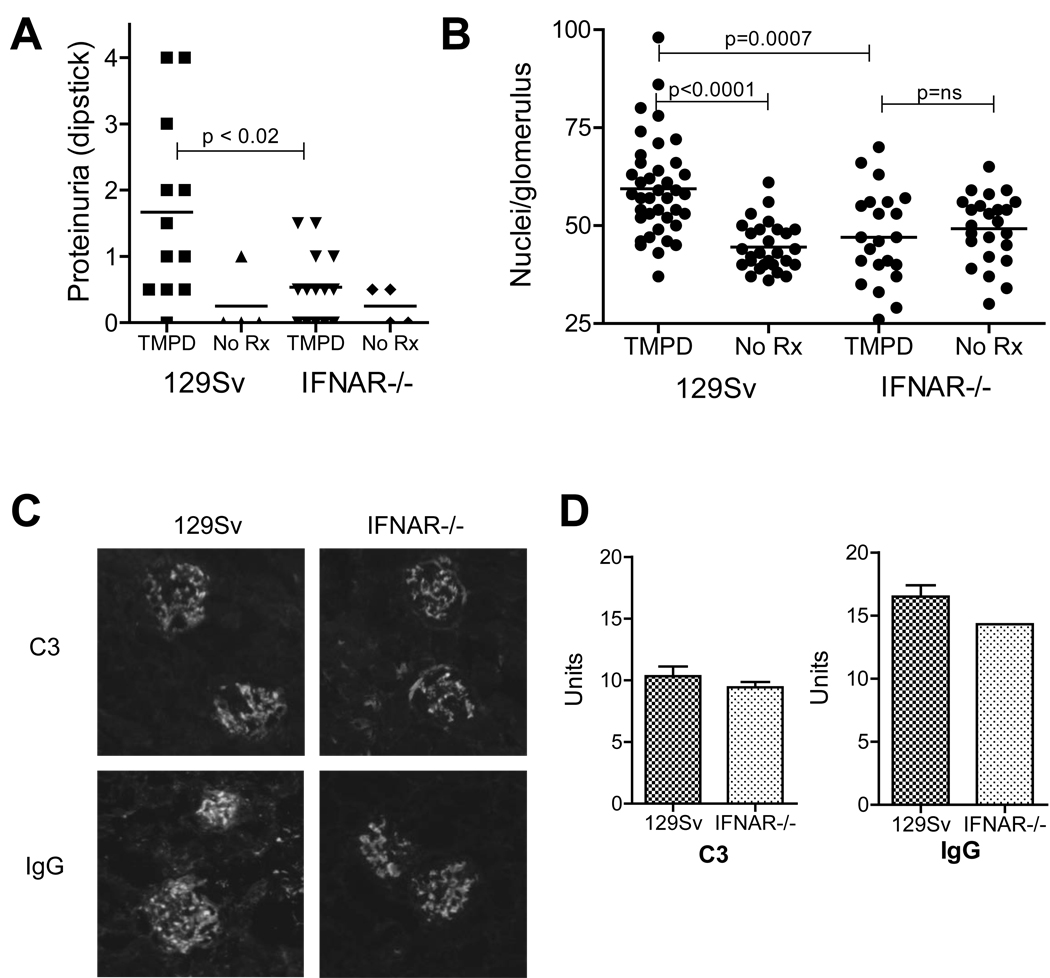
Results: Increased ISG expression was observed in the peripheral blood of TMPD-treated WT mice, but not in the peripheral blood of TMPD-treated IFNAR(-/-) mice. TMPD did not induce lupus-specific autoantibodies (anti-RNP, anti-Sm, anti-double-stranded DNA) in IFNAR(-/-) mice, whereas 129Sv controls developed these specificities. Although glomerular immune complexes were present in IFNAR(-/-) mice, proteinuria and glomerular hypercellularity did not develop, whereas these features of glomerulonephritis were found in the TMPD-treated WT controls. The clinical and serologic manifestations observed in TMPD-treated mice were strongly dependent on IFNAR signaling, which is consistent with the association of increased expression of ISGs with lupus-specific autoantibodies and nephritis in humans.

Conclusion: Similar to its proposed role in human SLE, signaling via the IFNAR is central to the pathogenesis of autoantibodies and glomerulonephritis in TMPD-induced lupus. This lupus model is the first animal model shown to recapitulate the "interferon signature" in peripheral blood.


Figures

Figure 1
Figure 1. Interferon signature in PBMCs of TMPD-treated mice
WT (129Sv) and 129Sv IFNAR−/− mice were treated with either TMPD (0.5 ml i.p.) or left untreated. Peripheral blood was collected in PAXgene tubes 6–8 months later for RNA isolation. Expression of the IFN-I inducible genes Mx1 (A), IRF-7 (B), and IP-10 (C) and of IFNβ (D) was measured by real-time PCR, normalized to β-actin. Gene expression was compared by the Mann-Whitney test. E, RT-PCR analysis of IFNα and IFNβ gene expression by peripheral blood cells from TMPD-treated WT and IFNAR−/− mice (18S RNA expression is shown as a control).
Figure 2
Figure 2. Expression of IFN-I regulated genes in TMPD-treated mice
Gene expression by cells from different peripheral sites in WT and IFNAR−/− mice was measured by real-time PCR, normalized to β-actin expression. Gene expression levels were compared using the Mann-Whitney test. A. Peritoneal exudate cells. Expression of Mx1, MCP-1, and IP-10 by peritoneal cells from WT and IFNAR−/− mice was measured. B. Ectopic lymphoid tissue (lipogranulomas). Expression of the IFN-I inducible genes Mx1 and MCP-1 and the non-IFN-regulated gene BLC in ectopic lymphoid tissue was determined. C. Spleen. Expression of Mx1, MCP-1, and BLC were measured.
Figure 3
Figure 3. Inflammatory response to TMPD in WT vs. IFNAR −/− mice
A, Peritoneal cell counts Peritoneal lavage was performed at 6–8 months in TMPD-treated WT or IFNAR−/− mice. Total cells were counted using a hemocytometer. B, Spleen weight. Spleens of WT or IFNAR−/− mice were weighed at 6–8 months after TMPD treatment. C, Flow cytometry of lipogranuloma cells. T and B cells were stained using anti-CD4 and anti-B220, respectively. Staining is represented as a percentage of total isolated lipogranuloma cells. D. H&E staining and immunohistochemistry. Top, Hematoxylin and eosin staining of ectopic lymphoid tissue from WT and IFNAR−/− mice treated 6–8 months earlier with TMPD. Bottom, Immunoperoxidase staining of ectopic lymphoid tissue from WT and IFNAR−/− mice treated 6–8 months earlier with TMPD. Anti-B220 and anti-CD3 are shown.
Figure 4
Figure 4. Autoantibody production
A, ANA in TMPD treated mice Sera from WT or IFNAR−/− mice treated 6–8 months earlier with TMPD or untreated mice were tested for ANA by immunofluorescence (1:40 dilution). ANA levels were compared using the Mann-Whitney test. B, Immunofluorescence pattern. HEp-2 cells were incubated with sera (1:40 dilution) from representative TMPD-treated WT or IFNAR−/− mice (left and right panels, respectively). Arrows indicate staining of mitotic chromosomes by sera from IFNAR−/− mice. C, frequencies of immunofluorescence staining. Shown is the % of WT and IFNAR−/− sera with nuclear (Nuc), cytoplasmic (Cyt) or both (Nuc + Cyt) staining patterns by indirect immunofluorescence. D, Anti-chromatin ELISA. Sera from TMPD-treated or untreated IFNAR−/− mice or 129Sv controls were tested by ELISA for reactivity with chicken erythrocyte chromatin. D, Decreased lupus autoantibodies in IFNAR −/− mice. Serum levels of IgG anti-nRNP/Sm, anti-Su, anti-dsDNA, and anti-ssDNA autoantibodies were measured by ELISA 6–8 months after treatment with TMPD (15 per group) or no treatment (12 per group). Autoantibody levels in WT and IFNAR −/− mice were compared using the Mann-Whitney test.
Figure 5
Figure 5. TMPD-induced autoantibodies in IFNAR−/− mice
A, Western blot Total proteins from K562 cell extract were probed with sera from IFNAR−/− or WT mice 6 months after TMPD treatment. Sera from the IFNAR−/− mice were negative, whereas sera from 2/4 WT mice exhibited reactivity with the U1-70K (anti-RNP) antigen and 1/4 with the U1-A protein, as determined by comparison with human reference sera and mAb 2.73 (anti-U1-70K) (not shown). B, Immunoprecipitation. Sera from TMPD-treated IFNAR−/− or WT mice were tested for reactivity with radiolabeled K562 cell extract. Positions of U snRNP proteins U5-200K (indicative of anti-Sm reactivity), U1-A, B’/B, C, D, E/F, and G are indicated on the left. C, Total IgG2a and IgM levels. Levels of total IgG2a (the predominant isotype of TMPD-induced autoantibodies) and IgM in sera from TMPD-treated or untreated IFNAR−/− mice or WT controls were measured by ELISA. IgM was significantly different between the IFNAR−/− and control groups (P = 0.017, Mann Whitney test).
Figure 6
Figure 6. Cytokine expression
A, IL-12, IFNβ, IL-6, and TNFα. Cytokines were measured in peritoneal lavage fluid by ELISA in WT and IFNAR−/− mice. B. BlyS/BAFF. BlyS/BAFF mRNA was quantified (normalized to β-actin) in lipogranulomas and peritoneal cells from WT and IFNAR−/− mice by real-time PCR.
Figure 7
Figure 7. Absence of renal disease in IFNAR −/− mice
A, Proteinuria. Absence of proteinuria in TMPD-treated IFNAR−/− mice (p < 0.02 vs. WT (129Sv) controls, Mann-Whitney test). B, Glomerular cellularity. Number of nuclei per glomerular cross-section, WT vs. IFNAR−/− mice (representative of 3 experiments). C, Immune complexes. Direct immunofluorescence of glomeruli for IgG and complement component C3. D, Quantification of IgG and C3 staining. Immunofluorescence staining intensity (IgG and C3) was measured by titration emulation (3 mice/group) in IFNAR−/− and WT mice.

Similar articles

Cited by

References

    1. Reeves WH, Narain S, Satoh M. Autoantibodies in systemic lupus erythematosus. In: Koopman WJ, editor. Arthritis and Allied Conditions, A Textbook of Rheumatology. Philadelphia: Lippincott Williams & Wilkins; 2004. pp. 1497–1521.
    1. Baechler EC, Batliwalla FM, Karypis G, Gaffney PM, Ortmann WA, Espe KJ, et al. Interferon-inducible gene expression signature in peripheral blood cells of patients with severe lupus. Proc Natl Acad Sci U S A. 2003;100(5):2610–2615. - PMC - PubMed
    1. Bennett L, Palucka AK, Arce E, Cantrell V, Borvak J, Banchereau J, et al. Interferon and granulopoiesis signatures in systemic lupus erythematosus blood. J Exp Med. 2003;197(6):711–723. - PMC - PubMed
    1. Kirou KA, Lee C, George S, Louca K, Papagiannis IG, Peterson MG, et al. Coordinate overexpression of interferon-alpha-induced genes in systemic lupus erythematosus. Arthritis Rheum. 2004;50(12):3958–3967. - PubMed
    1. Zhuang H, Narain S, Sobel E, Lee PY, Nacionales DC, Kelly KM, et al. Association of anti-nucleoprotein autoantibodies with upregulation of Type I interferon-inducible gene transcripts and dendritic cell maturation in systemic lupus erythematosus. Clin Immunol. 2005;117(3):238–250. - PubMed

Publication types