

A prototype RF dosimeter for independent measurement of the average specific absorption rate (SAR) during MRI
- PMID: 17969145
- PMCID: PMC2586170
- DOI: 10.1002/jmri.21141
A prototype RF dosimeter for independent measurement of the average specific absorption rate (SAR) during MRI
Abstract
Purpose: To develop a scanner-independent dosimeter for measuring the average radio frequency (RF) power deposition and specific absorption rates (SAR) for human MRI exposure.
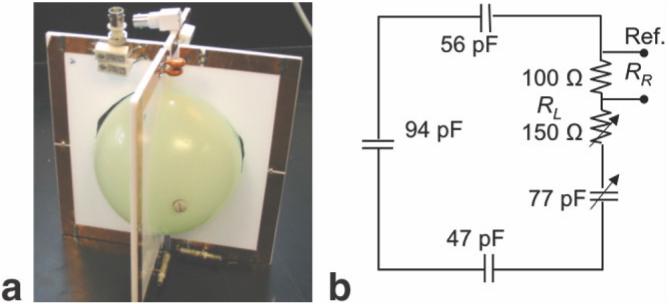
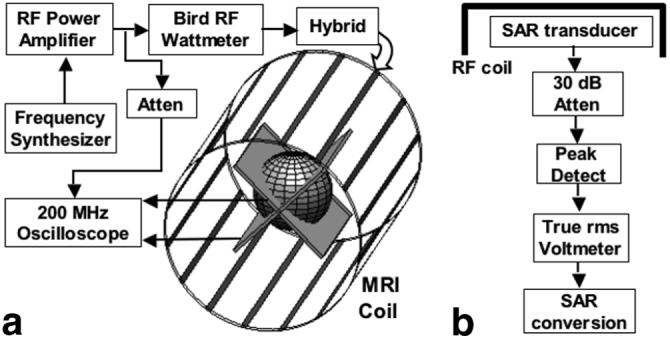
Materials and methods: A prototype dosimeter has a transducer with orthogonal conducting loops surrounding a small signal-generating MRI sample. The loops contain resistors whose values are adjusted to load the scanner's MRI coils equivalent to an average head or body during MRI. The scanner adjusts its power output to normal levels during setup, using the MRI sample. Following calibration, the total power and average SAR deposited in the transducer are measured from the root-mean-square (rms) power induced in the transducer during MRI.
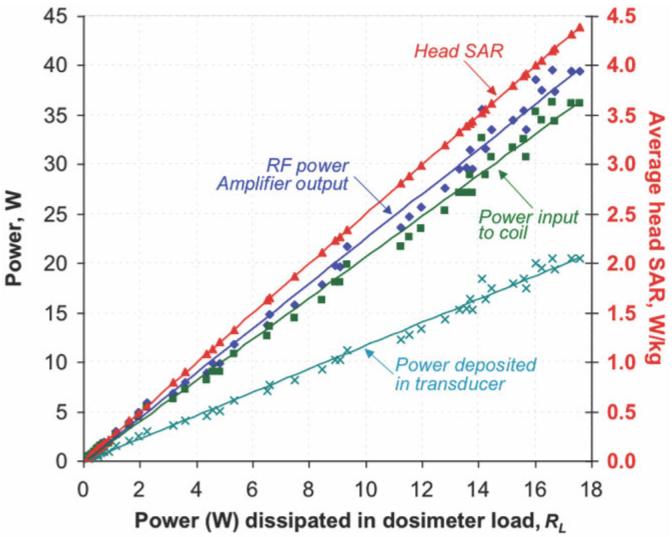
Results: A 1.5 Tesla head transducer was adjusted to elicit the same load as the average of nine adult volunteers. Once adjusted, the transducer loads other head coils the same as the head does. The dosimeter is calibrated at up to 20 W total deposited power and 4.5 W/kg SAR in the average head, with about 5% accuracy.
Conclusion: This dosimeter provides a simple portable means of measuring the power deposited in a body-equivalent sample load, independent of the scanner. Further work will develop SAR dosimetry for the torso and for higher fields.
Figures

Similar articles
-
A multichannel, real-time MRI RF power monitor for independent SAR determination.Med Phys. 2012 May;39(5):2334-41. doi: 10.1118/1.3700169. Med Phys. 2012. PMID: 22559603 Free PMC article.
-
An RF dosimeter for independent SAR measurement in MRI scanners.Med Phys. 2013 Dec;40(12):122303. doi: 10.1118/1.4829527. Med Phys. 2013. PMID: 24320534 Free PMC article.
-
Setup and dosimetry for exposure of human skin in vivo to RF-EMF at 900 MHz.Bioelectromagnetics. 2008 Apr;29(3):207-12. doi: 10.1002/bem.20383. Bioelectromagnetics. 2008. PMID: 18044739
-
Modeling of RF head exposure in children.Bioelectromagnetics. 2005;Suppl 7:S19-30. doi: 10.1002/bem.20155. Bioelectromagnetics. 2005. PMID: 16142772 Review.
-
Current problems and expected improvements in personal neutron dosimetry.Radiat Prot Dosimetry. 2004;110(1-4):743-5. doi: 10.1093/rpd/nch173. Radiat Prot Dosimetry. 2004. PMID: 15353741 Review.
Cited by
-
Progress in Understanding Radiofrequency Heating and Burn Injuries for Safer MR Imaging.Magn Reson Med Sci. 2023 Jan 1;22(1):7-25. doi: 10.2463/mrms.rev.2021-0047. Epub 2022 Feb 26. Magn Reson Med Sci. 2023. PMID: 35228437 Free PMC article. Review.
-
A multichannel, real-time MRI RF power monitor for independent SAR determination.Med Phys. 2012 May;39(5):2334-41. doi: 10.1118/1.3700169. Med Phys. 2012. PMID: 22559603 Free PMC article.
-
A whole-body RF dosimeter for independent SAR measurement in MR scanners.Proc Int Soc Magn Reson Med Sci Meet Exhib Int Soc Magn Reson Med Sci Meet Exhib. 2013;21:2823. Proc Int Soc Magn Reson Med Sci Meet Exhib Int Soc Magn Reson Med Sci Meet Exhib. 2013. PMID: 25360069 Free PMC article. No abstract available.
-
Occupational exposure to electromagnetic fields in magnetic resonance environment: basic aspects and review of exposure assessment approaches.Med Biol Eng Comput. 2018 Apr;56(4):531-545. doi: 10.1007/s11517-017-1779-7. Epub 2018 Jan 18. Med Biol Eng Comput. 2018. PMID: 29344902 Review.
-
Turning up the heat on MRI.J Am Coll Radiol. 2008 Jul;5(7):853-5. doi: 10.1016/j.jacr.2008.04.003. J Am Coll Radiol. 2008. PMID: 18585665 Free PMC article. Review. No abstract available.
References
-
- The Nobel Prize in Physiology or Medicine Press Release. Oct 62003. [Last accessed: August 22, 2007]. Available at: http://nobelprize.org/nobel_prizes/medicine/laureates/2003/press.html.
-
- Bottomley PA, Hart HR, Edelstein WA, et al. NMR imaging/spectroscopy system to study both anatomy and metabolism. Lancet. 1983;2:273–274. - PubMed
-
- Hardy CJ, Bottomley PA, Roemer PB, Redington RW. Rapid 31P spectroscopy on a 4 Tesla whole-body system. Magn Reson Med. 1988;8:104–109. - PubMed
-
- Vaughan JT, Garwood M, Collins CM, et al. 7T vs. 4T: RF power, homogeneity, and signal-to-noise comparison in head images. Magn Reson Med. 2001;46:24–30. - PubMed
-
- Young FE, Food and Drug Administration Fed Regist. 1988;53:7575–7579.
Publication types
MeSH terms
Grants and funding
LinkOut - more resources
Full Text Sources
Other Literature Sources
Medical
Miscellaneous
