. 2007 Sep;88(2):153-78.
doi: 10.1901/jeab.2007.41-06.

The differentiation of response numerosities in the pigeon

Affiliations

The differentiation of response numerosities in the pigeon

Armando Machado et al. J Exp Anal Behav. 2007 Sep.

Abstract

Two experiments examined how pigeons differentiate response patterns along the dimension of number. In Experiment 1, 5 pigeons received food after pecking the left key at least N times and then switching to the right key (Mechner's Fixed Consecutive Number schedule). Parameter N varied across conditions from 4 to 32. Results showed that run length on the left key followed a normal distribution whose mean and standard deviation increased linearly with N; the coefficient of variation approached a constant value (the scalar property). In Experiment 2, 4 pigeons received food with probability p for pecking the left key exactly four times and then switching. If that did not happen, the pigeons still could receive food by returning to the left key and pecking it for a total of at least 16 times and then switching. Parameter p varied across conditions from 1.0 to .25. Results showed that when p= 1.0 or p=.5, pigeons learned two response numerosities within the same condition. When p=.25, each pigeon adapted to the schedule differently. Two of them emitted first runs well described by a mixture of two normal distributions, one with mean close to 4 and the other with mean close to 16 pecks. A mathematical model for the differentiation of response numerosity in Fixed Consecutive Number schedules is proposed.


Figures
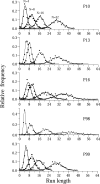
Fig 1
Fig 1
The relative frequency distribution of run length during the last five sessions of each condition. A condition was defined by the reinforcement criterion N. The curves are the best-fitting normal distributions (see parameters in Table 2).
Fig 2
Fig 2
The estimated means (top panels) and standard deviations (middle panels) of run length as a function of the reinforcement criterion N; the bottom panels show the coefficients of variation. The solid lines are the best-fitting regression lines.
Fig 3
Fig 3
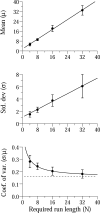
The means across pigeons of the estimated means (top), standard deviations (middle) and coefficients of variations (bottom) as a function of the reinforcement criterion N. The bars show ± one standard deviation. The solid lines are the averages of the best-fitting individual lines shown in Figure 2. In the bottom panel, the dotted line shows the asymptote approached by the mean coefficient of variation.
Fig 4
Fig 4
Group data from the present study (open triangles) are compared with the results from other studies. Mechner (1958) used 6 rats in a chamber with two levers. The open squares show the averages of the means (μ) and standard deviations (σ) estimated to fit individual frequency distributions. Platt and Johnson (1971) used 8 rats in a chamber with a lever (response A) and a hole for nose poking (response B). The open circles show the means and standard deviations estimated when fitting the data of a single rat. Laties (1972) used 4 pigeons with two response keys. The filled diamond shows the averages of the obtained means and standard deviations. Hobson and Newman (1981) used 12 pigeons with mixed FR–FCN schedules. Their data appear as filled squares in the lower two panels that display results for the means (μ) and the coefficient of variation (σ/μ).
Fig 5
Fig 5
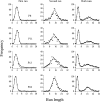
The absolute frequency distributions of the first run (r1, left panels), second run (r2, middle panels), and both runs (r1 and r1 + r2, right panels) during Condition 1 of Experiment 2 (p  =  1.0). The curves in the left and middle panels are best-fitting normal distributions with parameters (μ1, σ1) and (μ2, σ2), respectively (see Table 4). The curves in the right panels plot Equation 1 using the same parameters as the left and middle curves (i.e., μ1, σ1, μ2, and σ2).
Fig 6
Fig 6
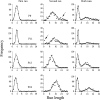
The absolute frequency distributions of the first run (r1, left panels), second run (r2, middle panels), and of both runs (r1 and r1 + r2, right panels) during Condition 4 of Experiment 2 (p  =  1.0). The curves in the left and middle panels are best-fitting normal distributions with parameters (μ1, σ1) and (μ2, σ2), respectively (see Table 4). The curves in the right panels plot Equation 1 using the same parameters as the left and middle curves (i.e., μ1, σ1, μ2, and σ2). The arrows show excessively short or excessively long runs.
Fig 7
Fig 7
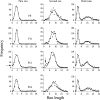
The absolute frequency distributions of the first run (r1, left panels), second run (r2, middle panels), and of both runs (r1 and r1 + r2, right panels) during Condition 2 of Experiment 2 (p  =  .5). The curves in the left and middle panels are best-fitting normal distributions with parameters (μ1, σ1) and (μ2, σ2), respectively (see Table 4). The curves in the right panels plot Equation 1 using the same parameters as the left and middle curves (i.e., μ1, σ1, μ2, and σ2). The arrows show excessively short runs.
Fig 8
Fig 8
The absolute frequency distributions of the first run (r1, left panels), second run (r2, middle panels), and of both runs (r1 and r1 + r2, right panels) during Condition 4 of Experiment 2 (p  =  .25). Left panels: For pigeons P12 and P18, the curves are best-fitting normal distributions with parameters (μ1, σ1). For pigeons P9 and P11 the curves are weighted averages of two normal distributions (see Equation 2), one with weight λ and the other with weight 1-λ (see Table 4). Middle panels: For pigeons P9, P12, and P18 the curves are best-fitting normal distributions with parameters (μ2, σ2). Right panels: For pigeons P9, P12, and P18 the curves plot Equation 1 using the same parameters as the left and middle curves. The arrows show excessively short runs.
Fig 9
Fig 9
The estimated standard deviations plotted against the estimated means of the run-length distributions in Experiment 1 (empty symbols) and Experiment 2, Conditions p  =  1.0 and p  =  .5 (filled symbols). Each symbol corresponds to a different pigeon. The two lines are the average of the individual best-fitting regression lines and account for 88 percent of the variance in the data of Experiment 1 and 89 percent in the data of Experiment 2.
Fig 10
Fig 10
A model of numerosity differentiation under FCN schedules with parameter N. On trial n, the animal samples a number X from a normal distribution with mean μ(n) and standard deviation σ(n)  =  γ × μ(n). If X, the run length on that trial, is less then N, then the trial ends in extinction and Δμ(n)  =  0. If X ≥ N and X < μ(n), the trial ends in reinforcement and Δμ(n)  =  –δ. If X ≥ N and X ≥ μ(N), the trial ends in reinforcement and Δμ(n)  =  α – βμ(n). The following relations hold: α > 0, β > 0, δ > 0, and δ > α.
Fig 11
Fig 11
The numerosity differentiation model fitted to the data of pigeon P10 (Experiment 1). Only the coefficient of variation γ was allowed to vary with N. The curves are averages of 100 simulations for each value of N.
Fig 12
Fig 12
The symbols show the averages of the individual frequency distributions for the 5 pigeons of Experiment 1. The curves show the averages of the individual curves predicted by the numerosity differentiation model.

Similar articles

Cited by

References

    1. Alsop B, Honig W.K. Sequential stimuli and relative numerosity discriminations in pigeons. Journal of Experimental Psychology: Animal Behavior Processes. 1991;17:386–395.
    1. Catania A.C, Reynolds G.S. A quantitative analysis of responding maintained by interval schedules of reinforcement. Journal of the Experimental Analysis of Behavior. 1968;11:327–383. - PMC - PubMed
    1. Emmerton J. Birds' judgments of number and quantity. In: Cook R.G, editor. Avian visual cognition. 2001.
    1. Fetterman J.G. Numerosity discrimination: Both time and number matter. Journal of Experimental Psychology: Animal Behavior Processes. 1993;19:149–164. - PubMed
    1. Fetterman J.G, Dreyfus L.R, Stubbs D.A. Scaling of response-based events. Journal of Experimental Psychology: Animal Behavior Processes. 1985;11:388–404.

Publication types

LinkOut - more resources