. 2007 Sep;88(2):285-317.
doi: 10.1901/jeab.2007.88-285.

A theory of attending, remembering, and reinforcement in delayed matching to sample

Affiliations

A theory of attending, remembering, and reinforcement in delayed matching to sample

John A Nevin et al. J Exp Anal Behav. 2007 Sep.

Erratum in

  • J Exp Anal Behav. 2008 Jul;90(1):130

Abstract

A theory of attending and reinforcement in conditional discriminations is extended to working memory in delayed matching to sample by adding terms for disruption of attending during the retention interval. Like its predecessor, the theory assumes that reinforcers and disruptors affect the independent probabilities of attending to sample and comparison stimuli in the same way as the rate of overt free-operant responding as suggested by Nevin and Grace, and that attending is translated into discriminative performance by the model of Davison and Nevin. The theory accounts for the effects of sample-stimulus discriminability and retention-interval disruption on the levels and slopes of forgetting functions, and for the diverse relations between accuracy and sensitivity to reinforcement reported in the literature. It also accounts for the effects of reinforcer probability in multiple schedules on the levels and resistance to change of forgetting functions; for the effects of reinforcer probabilities signaled within delayed-matching trials; and for the effects of reinforcer delay, sample duration, and intertrial-interval duration. The model accounts for some data that have been problematic for previous theories, and makes testably different predictions of the effects of reinforcer probabilities and disruptors on forgetting functions in multiple schedules and signaled trials.


Figures

Fig 1
Fig 1
The matrix of stimuli and responses defined by a conditional discrimination such as DMTS, where the samples are S1 or S2, and responses B1 and B2 are defined by the comparison stimuli C1 and C2. Cells are identified by row–column notation. Reinforcers for correct responses are designated R11 and R22; no consequences are arranged in the error Cells 12 and 21.
Fig 2
Fig 2
Time-line diagram of experimentally arranged events within a DMTS trial, and the times during which the subject is assumed to attend to the sample and comparisons. Times during which reinforcers and disruptors are assumed to operate on attending to samples or comparisons are also indicated. See text for explanation.
Fig 3
Fig 3
Illustrations of the ways in which probabilities of attending to the samples, p(As), and to the comparisons, p(Ac), depend on the length of the retention interval with several values of the disruptors x, z, q, and v, assuming mixed retention intervals and representative experimental parameters.
Fig 4
Fig 4
Effective reinforcer allocation in the cells of the stimulus–response matrix of Fig. 1. The discriminabilities of samples and comparisons are characterized as ds and dc, which may be conceptualized as distances between stimuli. Generalization between cells results from confusability of the samples and comparisons, 1/ds and 1/dc.
Fig 5
Fig 5
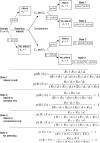
The upper part of this figure shows how probabilities of attending or not attending to the samples and comparisons in DMTS lead to four states that determine response probabilities p(B1|S1) and p(B1|S2) according to the expressions for each state in the lower part of the figure; note that p(B2|S1)  =  1− p(B1|S1), and p(B2|S2)  =  1− p(B1|S2). Failures to attend are equivalent to discriminabilities equal to 1, so that ds is omitted from expressions for states 3 and 4, and dc is omitted from expressions for states 2 and 4. Overall performance is predicted by weighting the response probabilities in each state by the probability of entering that state.
Fig 6
Fig 6
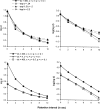
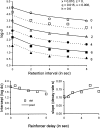
The upper left panel shows the forgetting function predicted by Equations 3 and 4 with ds  =  dc  =  400, with x  =  z  =  q  =  v  =  0.1, and with the representative experimental parameters used to generate the functions in Fig. 3. The predicted function (filled circles) is compared with some descriptive functions that have been used to characterize empirical forgetting functions: exponential (unfilled squares), hyperbolic (unfilled circles), and exponential with retention intervals scaled as t0.5 (filled triangles). Parameters are indicated in the legend. The upper right panel presents the same functions (with the same legend) as logarithms of log d, so that exponential functions are rendered as linear. The lower left panel illustrates the predicted effect of reducing sample discriminability, ds, from 400 to 4, together with the predicted effects of increasing background disruptors x and z from 0.1 to 0.5 with ds  =  400. The lower right panel presents the same functions (with the same legend) as logarithms of log d, showing that changes in sample discriminability or background disruption appear as changes in the intercept but not the slope of the forgetting function.
Fig 7
Fig 7
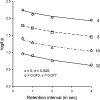
Forgetting functions predicted by Equations 3 and 4 with ds  =  dc  =  400, x  =  z  =  0.1, and with different values of q and v. The left panel presents the functions in their standard form with log d as the measure of accuracy; the right panel presents the same functions (with the same legend) as logarithms of log d to show that changes in retention-interval disruptors appear as changes in the slope of the forgetting function, with little or no change in the intercept.
Fig 8
Fig 8
The left panel shows that sensitivity to reinforcer ratios (a) is predicted to be roughly constant over the retention interval with ds  =  400 and with x  =  z  =  q  =  v  =  0.1 (filled circles). When q  =  0.2 and v  =  0 with ds  =  400, the function increases (unfilled circles). When ds is decreased to 4 with x  =  z  =  q  =  v  =  0.1 (filled squares), and with q  =  0.2 and v  =  0 (unfilled squares), the functions decrease. Thus, the slope of the predicted relation between a and the retention interval depends on sample discriminability and the values of parameters representing disruptors in Equations 3 and 4. The right panel shows that the predicted relation between log d and a for x  =  0.1, z  =  0.1, q  =  0.2, and v  =  0 decreases with ds  =  400 (unfilled circles) and increases with ds  =  4 (unfilled squares). The function with ds  =  400, x  =  0.2, z  =  0.5, q  =  0.1, and v  =  0.1 (unfilled triangles) mimics the effects of very short intertrial intervals reported by White and Wixted (1999).
Fig 9
Fig 9
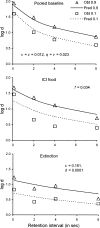
Forgetting functions reported by Odum, Shahan, & Nevin (2005) in multiple VI DMTS with reinforcer probabilities of .9 or .1 in the components. The top panel presents average forgetting functions in baseline, the middle panel presents forgetting functions pooled over 10 sessions with food presented during the ICI, and the bottom panel presents forgetting functions pooled over 10 sessions of extinction. Predictions based on Equations 8 and 9 are shown in each panel together with best-fitting parameter values; see text for explanation.
Fig 10
Fig 10
The left panel presents average response rates during the VI segment of rich (reinforcer probability .9) and lean (reinforcer probability .1) components of multiple VI DMTS before, during, and after cue reversal during the retention interval, and the right panel presents key pecking rates during retention intervals in the same format; vertical bars indicate the standard error.
Fig 11
Fig 11
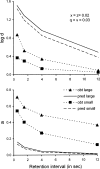
The upper left panel displays forgetting functions before and during retention-interval cue reversal averaged over subjects. The upper right panel shows the difference between mean log d in rich and lean components before, during, and after cue reversal. The bottom left panel presents forgetting functions predicted by the model with parameter values in the legend. The bottom right panel displays the forgetting functions during cue reversal as proportions of the prereversal baseline together with model predictions.
Fig 12
Fig 12
Forgetting functions based on average data reported by Schaal, Odum, & Shahan (2000) in multiple VI DMTS with VI 20-s and VI 120-s schedules in the components, compared with predictions based on Equations 3 and 4 with parameter values in the legend. The data have been transformed from proportion correct to logit p, which is equivalent to log d. See text for explanation.
Fig 13
Fig 13
Forgetting functions based on average data reported by Brown and White (2005) in DMTS trials with signaled reinforcer probabilities of 1.0 or .2, compared with predictions based on Equations 3 and 4 with parameter values in the legend. See text for explanation.
Fig 14
Fig 14
The left panel shows how accuracy depended on the log ratio of reinforcers for correct responses at four retention intervals in the average data of Jones and White (1992), and the right panel shows how sensitivity to reinforcement (a) depended on the retention interval. In the left panel, data are coded for the retention interval and compared with predictions (designated p) based on Equations 3 and 4, with parameter values in the legend; the grey-filled circle includes seriously discrepant data from one pigeon at the 0.01-s retention interval, and was not used in model fits. See text for explanation.
Fig 15
Fig 15
The upper panel shows forgetting functions for the average data reported by McCarthy and Voss (1995) for DMTS trials with signaled reinforcer magnitudes, and the lower panel shows how sensitivity to reinforcement (a) depended on the retention interval. In each panel, data are compared with predictions based on Equations 3 and 4; parameter values for predicted functions are given in the legend. See text for explanation.
Fig 16
Fig 16
The upper panel presents average forgetting functions obtained in a study by Sargisson and White (2003) with reinforcer delay (indicated at the right of each function) varied across conditions. To avoid overlap, successive functions are displaced upward by 0.5 log units. The lower panels show how the intercept (log d at 0 retention interval) and slope (decay rate, s) of exponential decay functions fitted to the forgetting functions in the upper panel change as a function of reinforcer delay. In each panel, data are compared with predictions based on Equations 3 and 4 with the value of delayed reinforcers decreased according to a hyperbolic function, with model parameters in the legend of the upper panel. See text for explanation.
Fig 17
Fig 17
Forgetting functions reported by Roberts and Kraemer (1982, Experiment 1), transformed from proportion correct to logit p (unfilled symbols), plotted separately for the ITI lengths indicated at the right of each function. To avoid overlap, successive functions are displaced upward by 0.5 log units. The accompanying lines are predictions of Equations 3 and 4 with model parameters in the legend. See text for explanation.
Fig 18
Fig 18
Forgetting functions reported by Grant (1976), transformed from proportion correct to logit p (unfilled symbols), plotted separately for the sample durations indicated at the right of each function. To avoid overlap, successive functions are displaced upward by 0.5 log units. The accompanying lines are predictions of Equations 3 and 4 with model parameters in the legend; the values of ds required to fit each function are given at the right. See text for explanation.
Fig 19
Fig 19
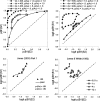
The upper left panel displays predicted isosensitivity curves relating p(B1|S1 to p(B1|S2) when the ratio of reinforcers for correct responses is varied, with values of ds, p(As), and p(Ac) indicated in the legend. The upper right panel displays the same functions with the axes transformed to logit p. The lower left panel presents the data of Jones (2003, Part 1) for variations in reinforcer probabilities over a wide range with zero retention interval to illustrate rough agreement with the predicted “improper” form of the isosensitivity curve (see also Nevin et al., 2005, for analysis and model fits). The lower right panel presents the data of Jones and White (1992, see Fig. 14) replotted as isosensitivity curves at four retention intervals. See text for explanation.

Similar articles

Cited by

References

    1. Alling K, Nickel M, Poling A. The effects of differential and nondifferential outcomes on response rates and accuracy under a delayed-matching-to-sample procedure. The Psychological Record. 1991;41:537–549.
    1. Alsop B. Detection and choice. New Zealand: University of Auckland; 1988.
    1. Alsop B, Porritt M. Discriminability and sensitivity to reinforcer magnitude in a detection task. Journal of the Experimental Analysis of Behavior. 2006;85:41–56. - PMC - PubMed
    1. Baum W.M. On two types of deviation from the matching law: Bias and undermatching. Journal of the Experimental Analysis of Behavior. 1974;22:231–242. - PMC - PubMed
    1. Blough D.S. Delayed matching in the pigeon. Journal of the Experimental Analysis of Behavior. 1959;2:151–160. - PMC - PubMed

Publication types

LinkOut - more resources