. 2007 Nov;228(Pt 2):139-52.
doi: 10.1111/j.1365-2818.2007.01838.x.

Characterization of spectral FRET imaging microscopy for monitoring nuclear protein interactions

Affiliations

Characterization of spectral FRET imaging microscopy for monitoring nuclear protein interactions

Ye Chen et al. J Microsc. 2007 Nov.

Abstract

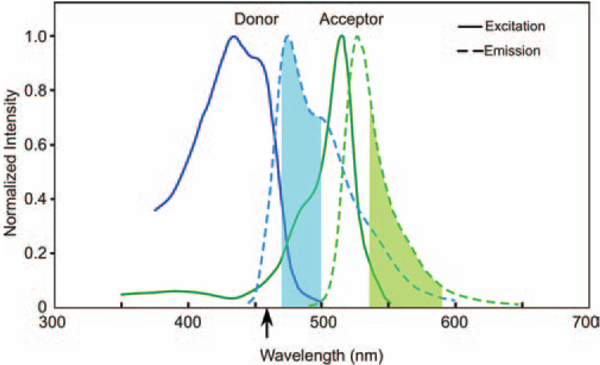
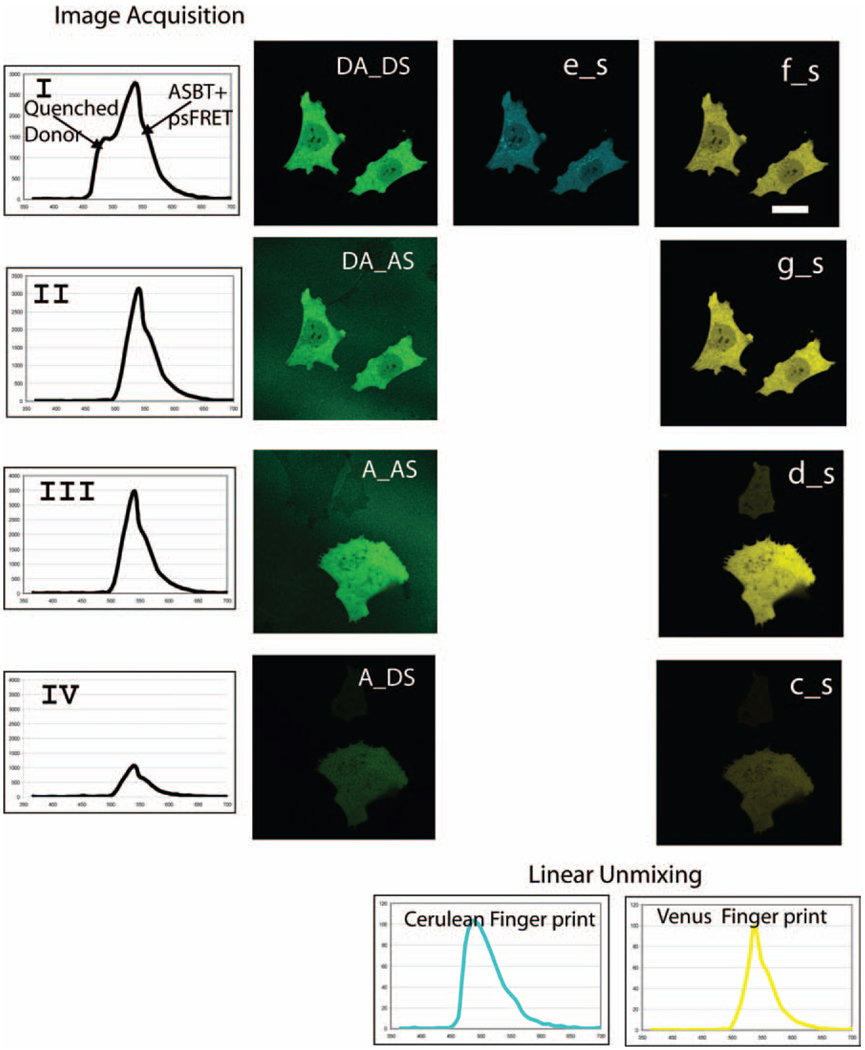
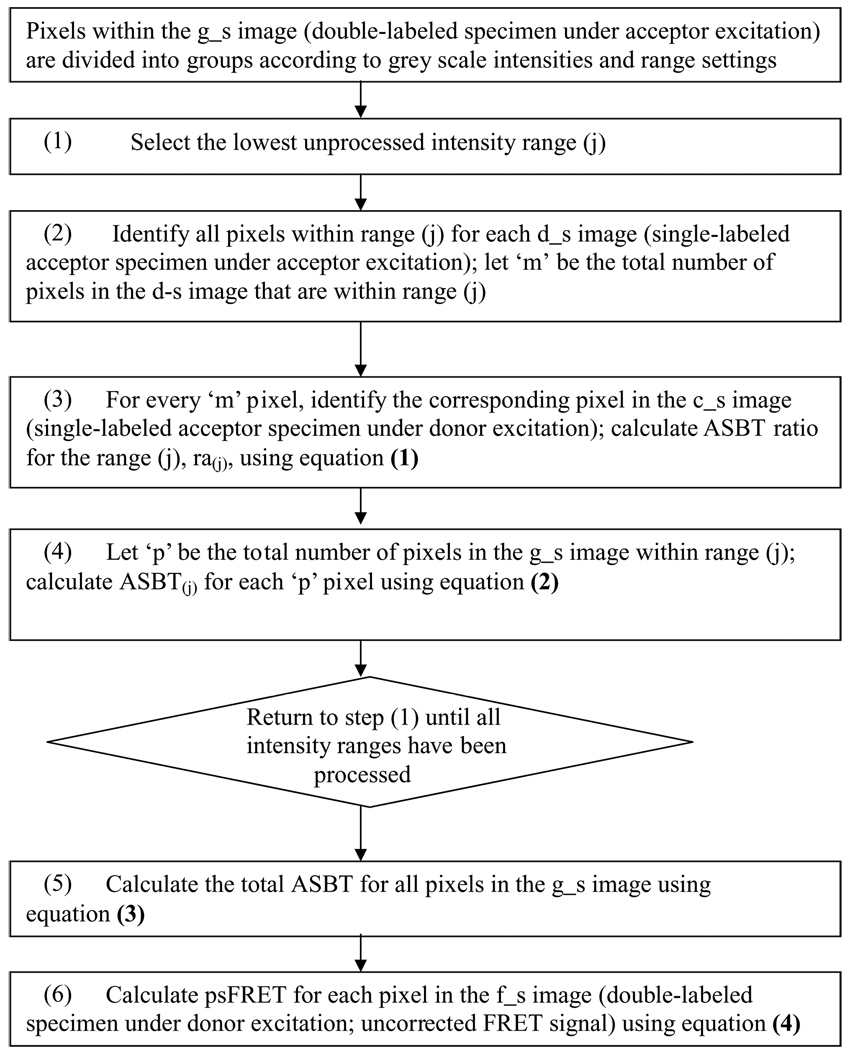
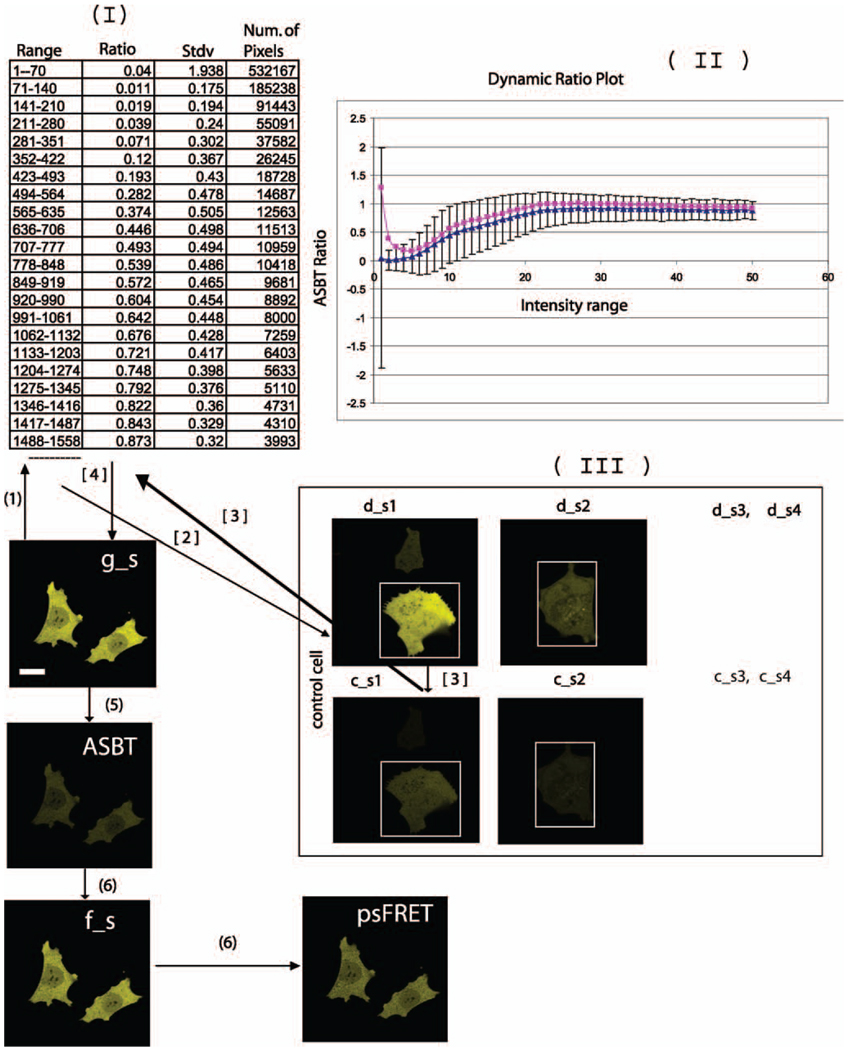
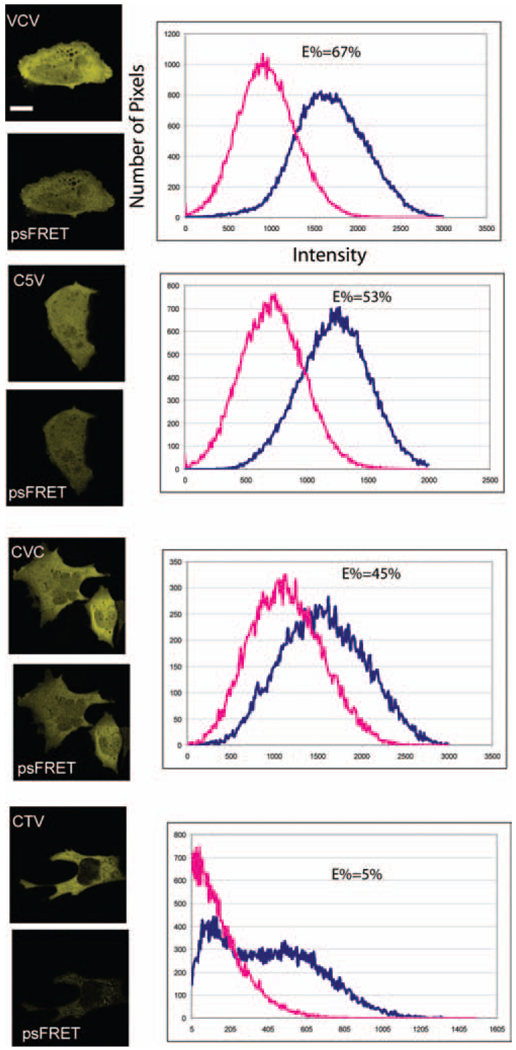
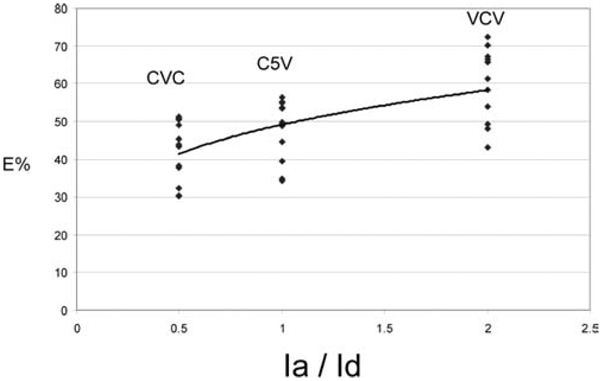
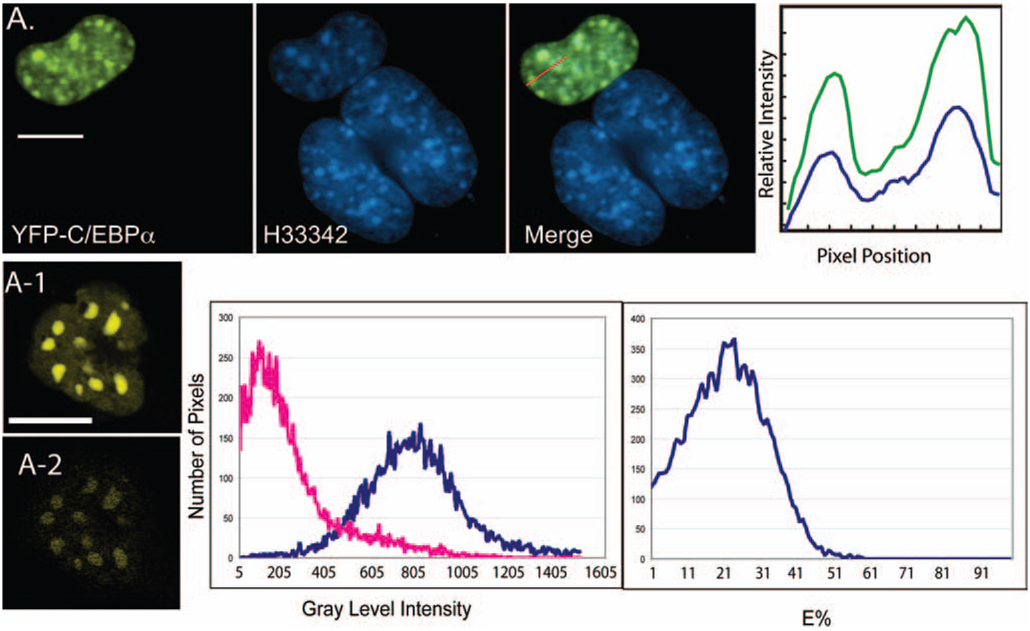
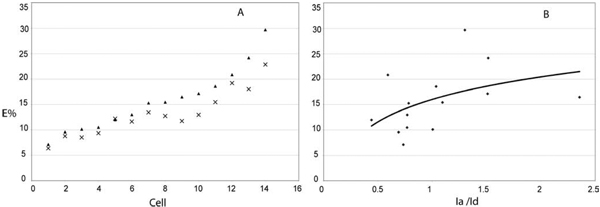
The spectral processed Förster resonance energy transfer (psFRET) imaging method provides an effective and fast method for measuring protein-protein interactions in living specimens. The commercially available linear unmixing algorithms efficiently remove the contribution of donor spectral bleedthrough to the FRET signal. However, the acceptor contribution to spectral bleedthrough in the FRET image cannot be similarly removed, since the acceptor spectrum is identical to the FRET spectrum. Here, we describe the development of a computer algorithm that measures and removes the contaminating ASBT signal in the sFRET image. The new method is characterized in living cells that expressed FRET standards in which the donor and acceptor fluorescent proteins are tethered by amino acid linkers of specific lengths. The method is then used to detect the homo-dimerization of a transcription factor in the nucleus of living cells, and then to measure the interactions of that protein with a second transcription factor.


Figures

Fig. 1
Fig. 1
SBT in filter-based intensity and spectral images. We use CFP as donor and YFP as acceptor. The CFP emission spectrum is displayed in a blue colour line and YFP emission spectrum is in a green colour line. When using filter-based intensity images for FRET, the donor emission is from 470 to 500 nm (shadowed cyan colour), and acceptor emission is from 535 to 590 nm (shadowed green–yellow colour). The quenched donor signal is part of the donor spectrum and the FRET signal is part of the acceptor spectrum. Because of the filter settings, there is acceptor back-bleedthrough into the donor emission channel (the green line inside the shadowed cyan colour) and donor bleedthrough into the acceptor emission channel (the blue broken line inside the shadowed green–yellow colour). We used our PFRET data analysis algorithm to correct these SBTs (Chen et al., 2005; Chen & Periasamy, 2006). Inspectral imaging (no filter used), after applying unmixing, the quenched donor signal is from the whole donor spectrum that is extracted from DA_DS and does not have any acceptor signal (acceptor back-bleedthrough) and the FRET signal is from the whole acceptor spectrum which is extracted from DA_DS and does not have any donor signal (donor bleedthrough) but still has ASBT.
Fig. 2
Fig. 2
Spectral FRET data acquisition and linear unmixing. GHFT1 cells expressing either Venus FP (acceptor) alone or directly coupled to two Cerulean FP (donor) (CVC, see Methods section). Same optical settings were used for both imaging single or double-labelled cells. These images were unmixed as described in the text using the reference spectra of donor and acceptor. Panel I: DA_DS is spectral image from double-labelled specimen under donor excitation; e_s and f_s are unmixed from DA_DS. Panel II: DA_AS is spectral image from the same double-labelled specimen but under acceptor excitation; g_s is unmixed from DA_AS. Panel III: A_AS is spectral image from single-labelled acceptor specimen under same acceptor excitation as that from double-labelled specimen; d_s is unmixed from A_AS. Panel IV: A_DS is spectral image from single-labelled acceptor specimen under same donor excitation as that from double-labelled specimen; c_s is unmixed from A_DS, which is only acceptor bleedthrough. There are donor components from unmixing for DA_AS, A_DS and A_AS, which are not shown in the figure and are not required for the data analysis. Cerulean FP and Venus FP fingerprints were obtained from single-labelled donor and single-labelled acceptor to use for linear unmixing (shown at the bottom of the figure). All the linear unmixing were implemented using Cerulean FP, Venus FP and background spectra (not shown) (scale bar: 10 µm)
Fig. 3
Fig. 3
Demonstration of the processed spectral FRET (psFRET) algorithm to remove the acceptor bleedthrough signal. (a) Flowchart for data processing using psFRET algorithm. (see Fig. 3b on page 7 to follow the flow chart); (b) Estimation of acceptor (Venus) bleedthrough ratio. (I) Bleedthrough ratio table. As an example, a portion of the range selection is shown (1–1558 grey level intensity). For that selected range, we have also shown the ratio, standard deviation and the number of pixels involved in the estimation. (II) The plot of dynamic ASBT ratio [ra, Eq. (1)] according to the table. The blue line is from background-subtracted images. The pink line is from non–background-subtracted images, which have a higher ratio. The bar represents standard deviation for 10 cells. (III) To avoid any bias produced by any set of control, several control cells are required for calculating the ratio. The ratio table is produced from 10 sets of controls, only two are displayed here. At lower intensity, the bleedthrough standard deviation is very high. It is from the background area (outside of the white rectangle) and it will not affect the calculation since it is only applied to the background area of g_s. The processing is based on whole images of control cells regardless of the location of the background and fluorescent signal. The number (1) through (6) shows how the data are processed. It matches the number in the flowchart. (see the step-by-step instructions in the text)
Fig. 3
Fig. 3
Demonstration of the processed spectral FRET (psFRET) algorithm to remove the acceptor bleedthrough signal. (a) Flowchart for data processing using psFRET algorithm. (see Fig. 3b on page 7 to follow the flow chart); (b) Estimation of acceptor (Venus) bleedthrough ratio. (I) Bleedthrough ratio table. As an example, a portion of the range selection is shown (1–1558 grey level intensity). For that selected range, we have also shown the ratio, standard deviation and the number of pixels involved in the estimation. (II) The plot of dynamic ASBT ratio [ra, Eq. (1)] according to the table. The blue line is from background-subtracted images. The pink line is from non–background-subtracted images, which have a higher ratio. The bar represents standard deviation for 10 cells. (III) To avoid any bias produced by any set of control, several control cells are required for calculating the ratio. The ratio table is produced from 10 sets of controls, only two are displayed here. At lower intensity, the bleedthrough standard deviation is very high. It is from the background area (outside of the white rectangle) and it will not affect the calculation since it is only applied to the background area of g_s. The processing is based on whole images of control cells regardless of the location of the background and fluorescent signal. The number (1) through (6) shows how the data are processed. It matches the number in the flowchart. (see the step-by-step instructions in the text)
Fig. 4
Fig. 4
Verification of psFRET with FRET standards. Four FRET standards were used to demonstrate the developed psFRET algorithm for removing acceptor bleedthrough. Blue—before correction. Red—after acceptor bleedthrough correction. Respective E% values are listed in the graph. (scale bar: 10 µm)
Fig. 5
Fig. 5
Comparison of E% with Ia/Id ratio. This graph is plotted for 10 cells for CVC, C5V and VCV FRET standards. E% increases with increasing Ia/Id ratio, indicating that the presence of more acceptor molecule increases the rate of energy transfer.
Fig. 6
Fig. 6
Measurement of C/EBPα protein dimerization in GHFT1 cells. The psFRET algorithm helps to identify the protein dimerization (A-2) involving the basic region–lucine zipper (B-zip) transcription factor C/EBPα. The upper panel shows the expression of YFP with C/EBPα and its accumulation in the region of centromeric heterochromatin stained by the DNA dye H33342 [The upper panel images were acquired using the arc lamp, filter-based wide-field microscope system as described in the literature (Day et al., 2003)]. A-1 is sFRET contaminated with ASBT. Histogram before (blue colour) and after (red colour) ASBT removal. Histogram of E% distribution from this cell is also shown. (scale bar: 10 µm)
Fig. 7
Fig. 7
Measurement of non-homologous protein (C/EBPα-Pit-1) interactions. The interaction of YFP-Pit-1 and CFP-C/EBPα is clearly shown (B-2) as a diffuse signal in the GHFT1 nucleus compared to the localization of the C/EBPα dimer to areas of heterochromatin shown in Fig. 6. Panel A: Expression of YFP-Pit-1 and the DNA stain using H33342 and the merged image. Panel B: Expressed YFP-Pit-1 and CFP-C/EBPα and the merged image [The images in Panel A and B were acquired using the arc lamp, filter-based wide-field microscope system as described in the literature (Day et al., 2003)]. B-1 is the sFRET contaminated with ASBT. B-2 is the psFRET and the respective histogram before (blue colour) and after ASBT removal. Histogram of the E% distribution is also shown. (scale bar: 10 µm)
Fig. 8
Fig. 8
Measurement of E% and stoichiometry of donor and acceptor fluorophores. A: The variation in E% in different cells before (x) and after (▲) background correction. It is very obvious to see that the E% changes depending on the expression level in transfected cells. B: Higher energy transfer when the acceptor molecules are more than the donor indicating that the donor has more pathways to transfer the energy to the neighbouring acceptors.

Similar articles

Cited by

References

    1. Bastiaens PI, Jovin TM. Microspectroscopic imaging tracks the intracellular processing of a signal transduction protein: fluorescent-labeled protein kinase C beta I. Proc. Natl. Acad. Sci. USA. 1996;93:8407–8412. - PMC - PubMed
    1. Berney C, Danuser G. FRET or no FRET: a quantitative comparison. Biophys. J. 2003;84:3992–4010. - PMC - PubMed
    1. Centonze VE, Sun M, Masuda A, Gerritsen H, Herman B. Fluorescence resonance energy transfer imaging microscopy. Meth. Enzymol. 2003;360:542–560. - PubMed
    1. Chen Y, Mills JD, Periasamy A. Protein interactions in cells and tissues using FLIM and FRET. Differentiation. 2003;71:528–541. - PubMed
    1. Chen Y, Periasamy A. Characterization of two-photon excitation fluorescence lifetime imaging microscopy for protein localization. Microsc. Res. Tech. 2004;63:72–80. - PubMed

Publication types