

Acoustic cardiography augments prolonged QRS duration for detecting left ventricular dysfunction
- PMID: 17970957
- PMCID: PMC6932006
- DOI: 10.1111/j.1542-474X.2007.00181.x
Acoustic cardiography augments prolonged QRS duration for detecting left ventricular dysfunction
Abstract
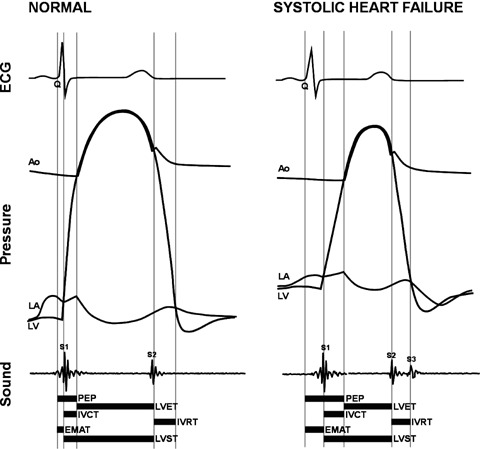
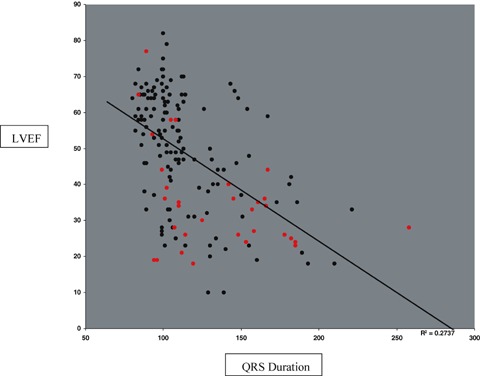
Background: Prolonged QRS duration has been used as a marker for left ventricular (LV) systolic dysfunction (SD) and is used in the evaluation of patients presenting with known or suspected heart failure. The goal of this study was to compare the abilities of QRS duration and simultaneous digital ECG and heart sounds, that is acoustic cardiographic, parameters to identify patients with LV dysfunction.
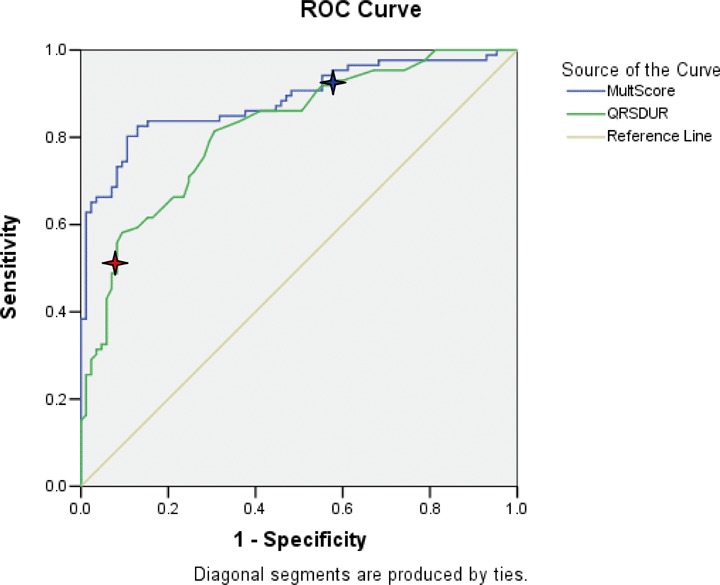
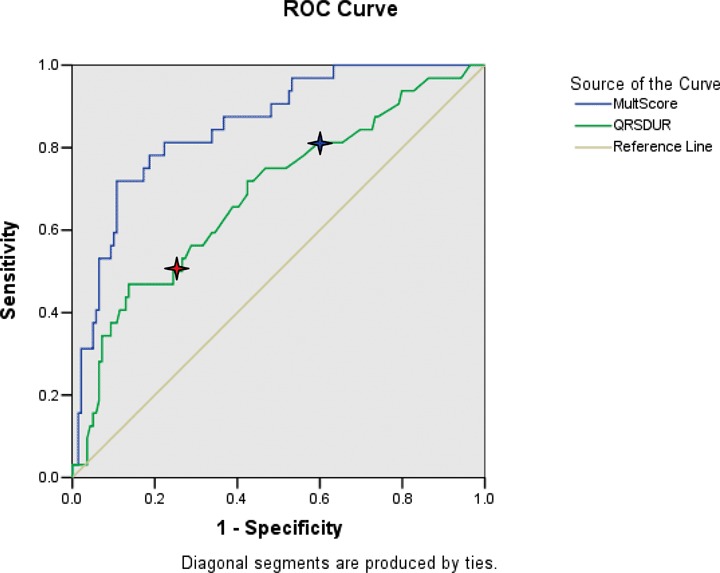
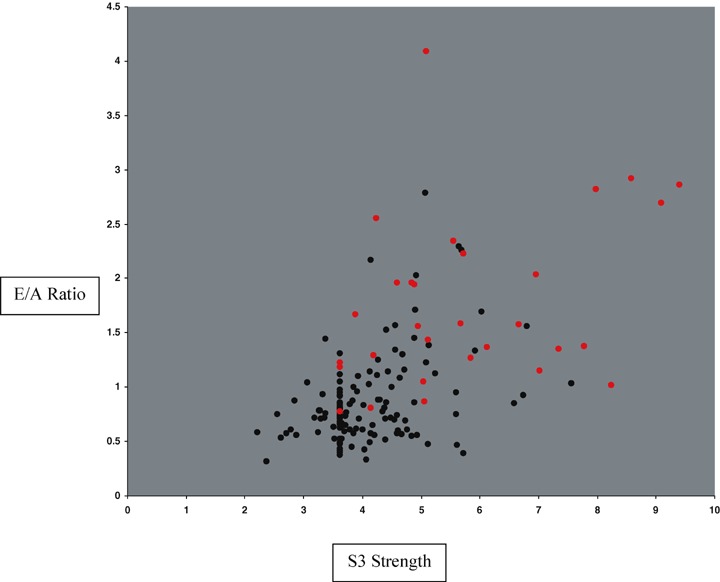
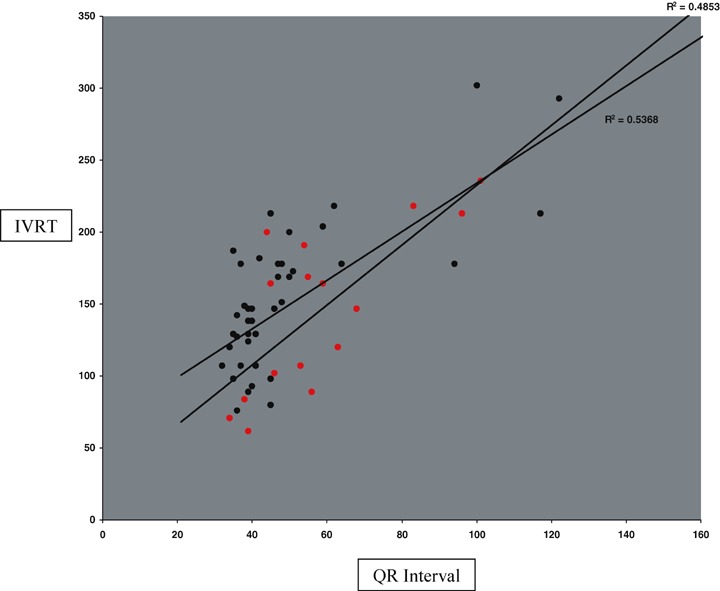
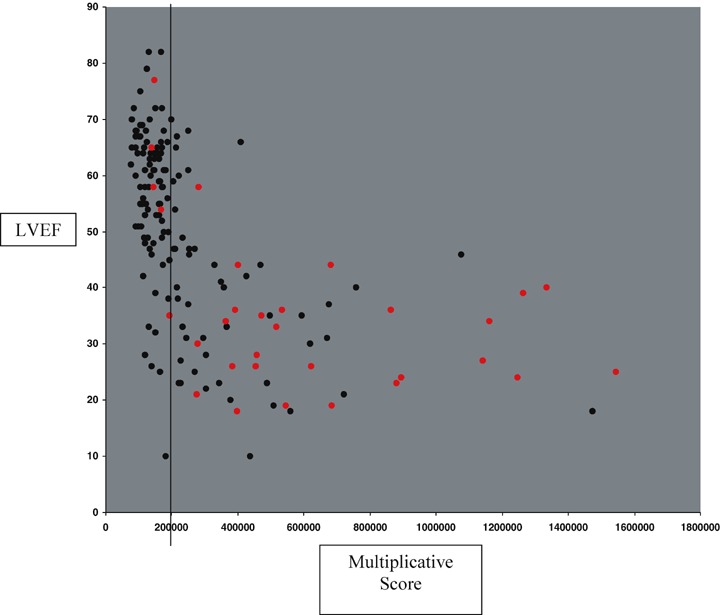
Methods: Our learning population consisted of 171 patients with possible chronic compensated or mildly decompensated heart failure who presented to an ambulatory cardiology clinic for echocardiographic examination. We defined LVSD as a LV ejection fraction < 50%, and estimated LV filling pressures from diastolic measurements. These patients also had acoustic cardiographic recordings from which we obtained a variety of individual ECG and acoustic cardiographic parameters. We used the product of four of these parameters to obtain a diagnostic score for LV dysfunction. We then compared the diagnostic performances of QRS duration and the score on a test population of patients who presented to an emergency department with possible heart failure.
Results: In the learning population, the sensitivities/specificities of QRS duration > or =120 ms and the score for prediction of LVSD were 51%/92% and 77%/90%, respectively. In the test population, the score remained superior to QRS duration for detecting LVSD as well as acute decompensated heart failure.
Conclusions: Improved identification of LVSD and clinical heart failure can be achieved with a cost-effective bedside screening tool with the simple combination of simultaneously acquired digital ECG and heart sound data.
Figures
Similar articles
-
Noninvasive detection of left ventricular systolic dysfunction by acoustic cardiography in cardiac failure patients.J Card Fail. 2008 May;14(4):310-9. doi: 10.1016/j.cardfail.2007.12.004. J Card Fail. 2008. PMID: 18474344
-
Rapid bedside identification of high-risk population in heart failure with reduced ejection fraction by acoustic cardiography.Int J Cardiol. 2013 Oct 3;168(3):1881-6. doi: 10.1016/j.ijcard.2012.12.064. Epub 2013 Jan 24. Int J Cardiol. 2013. PMID: 23352488
-
QRS prolongation on surface ECG and brain natriuretic peptide as indicators of left ventricular systolic dysfunction.J Intern Med. 2004 Feb;255(2):206-12. doi: 10.1046/j.1365-2796.2003.01265.x. J Intern Med. 2004. PMID: 14746557
-
Clinical aspects of left ventricular diastolic function assessed by Doppler echocardiography following acute myocardial infarction.Dan Med Bull. 2001 Nov;48(4):199-210. Dan Med Bull. 2001. PMID: 11767125 Review.
-
[Diastolic function of the left ventricle and congestive heart failure with normal systolic function].Ital Heart J Suppl. 2000 Oct;1(10):1273-80. Ital Heart J Suppl. 2000. PMID: 11068708 Review. Italian.
Cited by
-
Use of acoustic cardiography immediately following electrical cardioversion to predict relapse of atrial fibrillation.J Atr Fibrillation. 2017 Jun 30;10(1):1527. doi: 10.4022/jafib.1527. eCollection 2017 Jun-Jul. J Atr Fibrillation. 2017. PMID: 29250219 Free PMC article.
-
Aspects of left ventricular morphology outperform left ventricular mass for prediction of QRS duration.Ann Noninvasive Electrocardiol. 2010 Apr;15(2):124-9. doi: 10.1111/j.1542-474X.2010.00352.x. Ann Noninvasive Electrocardiol. 2010. PMID: 20522052 Free PMC article.
-
Mobile Cardiac Acoustic Monitoring System to Evaluate Left Ventricular Systolic Function in Pacemaker Patients.J Clin Med. 2022 Jul 3;11(13):3862. doi: 10.3390/jcm11133862. J Clin Med. 2022. PMID: 35807146 Free PMC article.
-
Application of Acoustic Cardiography in Assessment of Cardiac Function in Horses with Atrial Fibrillation Before and After Cardioversion.Animals (Basel). 2025 Jul 7;15(13):1993. doi: 10.3390/ani15131993. Animals (Basel). 2025. PMID: 40646892 Free PMC article.
-
Systolic time intervals combined with Valsalva maneuver for the diagnosis of left ventricular dysfunction in COPD exacerbations.Int J Chron Obstruct Pulmon Dis. 2016 Sep 15;11:2237-2243. doi: 10.2147/COPD.S96280. eCollection 2016. Int J Chron Obstruct Pulmon Dis. 2016. PMID: 27695311 Free PMC article.
References
-
- American Heart Association . Heart Disease and Stroke Statistics ‐ 2005 Update. Dallas , TX : American Heart Association; 2005.
-
- Cleland JGF, Daubert J‐C, Erdmann E, et al for the Cardiac Resynchronization‐Heart Failure (CARE‐HF) Study Investigators . The effect of cardiac resynchronization on morbidity and mortality in heart failure. N Engl J Med 2005;352:1539–1549. - PubMed
-
- Kearney MT, Zaman A, Eckberg DL, et al Cardiac size, autonomic function, and 5‐year follow‐up of chronic heart failure patients with severe prolongation of ventricular activation. J Card Fail 2003;9:93–99. - PubMed
-
- Shenkman HJ, Pampati V, Khandelwal AK, et al Congestive heart failure and QRS duration. Chest 2002;528–534. - PubMed
-
- Iuliano S, Fisher SG, Karasik PE, et al QRS duration and mortality in patients with congestive heart failure. Am Heart J 2002;143:1085–1091. - PubMed
Publication types
MeSH terms
LinkOut - more resources
Full Text Sources
