

Measuring global health inequity
- PMID: 17971215
- PMCID: PMC2147004
- DOI: 10.1186/1475-9276-6-16
Measuring global health inequity
Abstract
Background: Notions of equity are fundamental to, and drive much of the current thinking about global health. Health inequity, however, is usually measured using health inequality as a proxy - implicitly conflating equity and equality. Unfortunately measures of global health inequality do not take account of the health inequity associated with the additional, and unfair, encumbrances that poor health status confers on economically deprived populations.
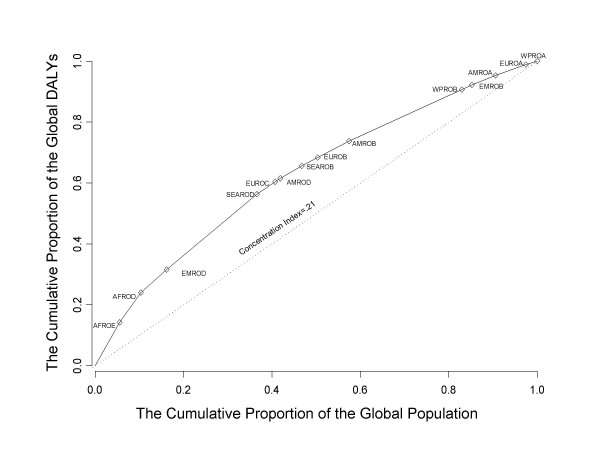
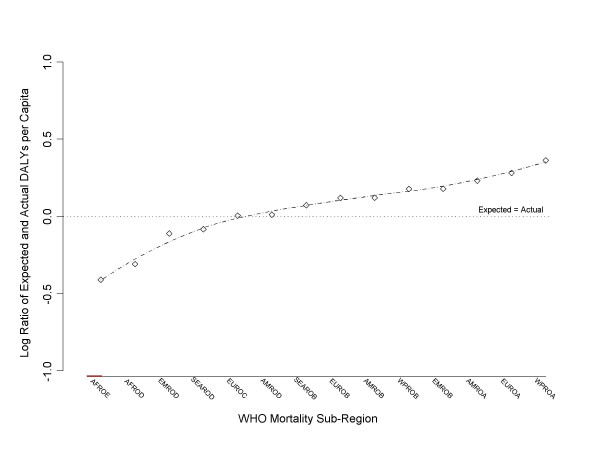
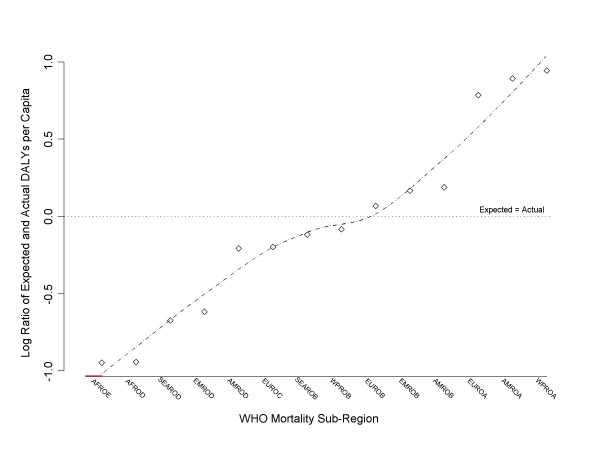
Method: Using global health data from the World Health Organization's 14 mortality sub-regions, a measure of global health inequality (based on a decomposition of the Pietra Ratio) is contrasted with a new measure of global health inequity. The inequity measure weights the inequality data by regional economic capacity (GNP per capita).
Results: The least healthy global sub-region is shown to be around four times worse off under a health inequity analysis than would be revealed under a straight health inequality analysis. In contrast the healthiest sub-region is shown to be about four times better off. The inequity of poor health experienced by poorer regions around the world is significantly worse than a simple analysis of health inequality reveals.
Conclusion: By measuring the inequity and not simply the inequality, the magnitude of the disparity can be factored into future economic and health policy decision making.
Figures
Similar articles
-
Unexplained health inequality--is it unfair?Int J Equity Health. 2015 Jan 31;14:11. doi: 10.1186/s12939-015-0138-2. Int J Equity Health. 2015. PMID: 25637028 Free PMC article.
-
Socio-economic inequality and inequity in use of health care services in Kenya: evidence from the fourth Kenya household health expenditure and utilization survey.Int J Equity Health. 2019 Dec 18;18(1):196. doi: 10.1186/s12939-019-1106-z. Int J Equity Health. 2019. PMID: 31849334 Free PMC article.
-
A framework for measuring health inequity.J Epidemiol Community Health. 2005 Aug;59(8):700-5. doi: 10.1136/jech.2004.031054. J Epidemiol Community Health. 2005. PMID: 16020649 Free PMC article.
-
Understanding Health Inequality, Disparity and Inequity in Africa: A Rapid Review of Concepts, Root Causes, and Strategic Solutions.Public Health Chall. 2025 Mar 11;4(1):e70040. doi: 10.1002/puh2.70040. eCollection 2025 Mar. Public Health Chall. 2025. PMID: 40496105 Free PMC article. Review.
-
The Minderoo-Monaco Commission on Plastics and Human Health.Ann Glob Health. 2023 Mar 21;89(1):23. doi: 10.5334/aogh.4056. eCollection 2023. Ann Glob Health. 2023. PMID: 36969097 Free PMC article. Review.
Cited by
-
Report on the Joint Workshop on the Relations between Health Inequalities, Ageing and Multimorbidity, Iceland, May 3-4, 2023.Clin Epidemiol. 2024 Jan 16;16:9-22. doi: 10.2147/CLEP.S443152. eCollection 2024. Clin Epidemiol. 2024. PMID: 38259327 Free PMC article.
-
The impact of economic growth on health care utilization: a longitudinal study in rural Vietnam.Int J Equity Health. 2013 Mar 16;12:19. doi: 10.1186/1475-9276-12-19. Int J Equity Health. 2013. PMID: 23497015 Free PMC article.
-
Does the trans-provincial immediate reimbursement reduce health gap between urban and rural floating population? Evidence from China.BMC Public Health. 2025 May 17;25(1):1826. doi: 10.1186/s12889-025-23027-1. BMC Public Health. 2025. PMID: 40382571 Free PMC article.
-
A cost-based equity weight for use in the economic evaluation of primary health care interventions: case study of the Australian Indigenous population.Int J Equity Health. 2009 Oct 7;8:34. doi: 10.1186/1475-9276-8-34. Int J Equity Health. 2009. PMID: 19807930 Free PMC article.
-
Using decision trees for measuring gender equity in the timing of angiography in patients with acute coronary syndrome: a novel approach to equity analysis.Int J Equity Health. 2015 Dec 23;14:155. doi: 10.1186/s12939-015-0280-x. Int J Equity Health. 2015. PMID: 26698302 Free PMC article.
References
LinkOut - more resources
Full Text Sources
